A simple first order ode evaluated at specific points

| categories: odes | View Comments

A simple first order ode evaluated at specific points

A simple first order ode evaluated at specific points

In Post 648 , we integrated an ODE over a specific time span. Sometimes it is desirable to get the solution at specific points, e.g. at t = [0 0.2 0.4 0.8]; This could be desirable to compare with experimental measurements at those time points. This post demonstrates how to do that.

$$\frac{dy}{dt} = y(t)$$

The initial condition is y(0) = 1.

function ode_01_1
close all; clc;
y0 = 1; % initial condition y(t=t0)
tspan = [0 0.2 0.4 0.8]; % the solution will only be evaluated at these
                         % points.
[t,y] = ode45(@myode,tspan,y0);

plot(t,y,'ko-')
xlabel('time')
ylabel('y(t)')
'end'
ans =

end

function dydt = myode(t,y)
% differential equation to solve
dydt = y;

% categories: ODEs
% tags: math
Read and Post Comments

Fit a line to numerical data

| categories: data analysis | View Comments

Fit a line to numerical data

Fit a line to numerical data

John Kitchin

Contents

Problem statement

fit a line to this data

x = [0 0.5 1 1.5 2.0 3.0 4.0 6.0 10];
y = [0 -0.157 -0.315 -0.472 -0.629 -0.942 -1.255 -1.884 -3.147];

polyfit(x,y,n) where n is the polynomial order, n=1 for a line

note that the output of this command is a "polynomial in Matlab. See polynomials for more details.

p = polyfit(x,y,1)

slope=p(1)
intercept=p(2)
p =

   -0.3145    0.0006


slope =

   -0.3145


intercept =

  6.2457e-004

we can calculate the fitted values with polyval

fittedy = polyval(p,x);

or by hand

fittedy2 = slope*x + intercept;

plot each method for comparison

figure(1)
hold on
plot(x,y,'ro','DisplayName','raw data')
plot(x,fittedy,'k-','DisplayName','fit from polyval')
plot(x,fittedy2,'y-- ','DisplayName','fit from equation by hand')
xlabel('x')
ylabel('y')
legend show
% These should be indistinguishable. We use combinations of symbols with no
% lines, solid lines, and dashed lines to see that all curves are the same.

% categories: Data analysis
% tags: math
% post_id = 650; %delete this line to force new post;
Read and Post Comments

Numerical solution to a simple ode

| categories: odes | View Comments

Numerical solution to a simple ode:

Numerical solution to a simple ode:

Integrate this ordinary differential equation (ode)

Contents

$$\frac{dy}{dt} = y(t)$$

over the time span of 0 to 2. The initial condition is y(0) = 1.

to solve this equation, you need to create a function or function handle of the form: dydt = f(t,y) and then use one of the odesolvers, e.g. ode45.

function main

problem setup

y0 = 1; % initial condition y(t=t0)
t0 = 0; tend=2;
tspan = [t0 tend]; % span from t=0 to t=2
[t,y] = ode45(@myode,tspan,y0); % here is where you get the solution

plot(t,y)
xlabel('time')
ylabel('y(t)')

analytical solution

Hopefully you recognize the solution to this equation is $y(t)=e^t$
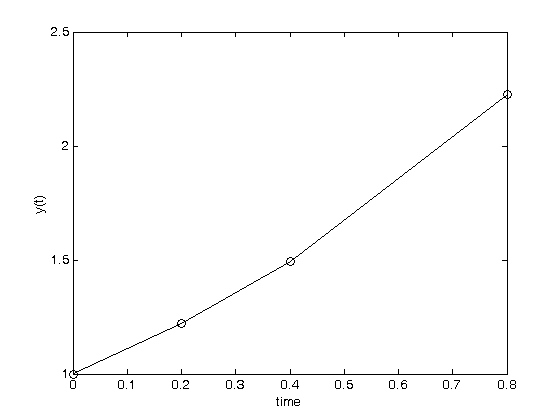
. Let's plot that on the same graph. We will use a dashed red line
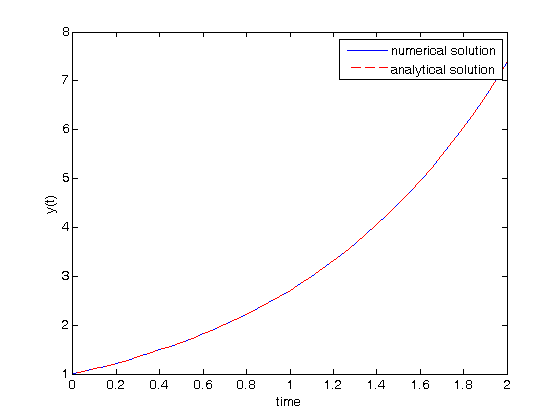
hold on
plot(t,exp(t),'r--')
legend('numerical solution','analytical solution')
% these are clearly the same solution.
'end'
ans =

end

function dydt = myode(t,y)

differential equation to solve $\frac{dy}{dt} = y(t)$

dydt = y;

% categories: ODEs
% tags: math
Read and Post Comments

Determining linear independence of a set of vectors

| categories: linear algebra | View Comments

Determining linear independence of a set of vectors

Determining linear independence of a set of vectors

Occasionally we have a set of vectors and we need to determine whether the vectors are linearly independent of each other. This may be necessary to determine if the vectors form a basis, or to determine how many independent equations there are, or to determine how many independent reactions there are.

Reference: Kreysig, Advanced Engineering Mathematics, sec. 7.4

Contents

Problem set 7.4 - #15

v1 = [6 0 3 1 4 2];
v2 = [0 -1 2 7 0 5];
v3 = [12 3 0 -19 8 -11];

R = rank([v1; v2; v3])
[rows, ~] = size([v1; v2; v3])
% note the ~ in the output indicates we do not care what the value is.

% the number of rows is greater than the rank, so these vectors are not
% independent. Let's demonstrate that one vector can be defined as a linear
% combination of the other two vectors. Mathematically we represent this
% as:
%
% $x_1 \mathit{v1} + x_2 \mathit{v2} = v3%
%
% or
%
% [x_1 x_2][v1; v2] = v3
%
% this is not the usual linear algebra form of Ax = b. To get there, we
% transpose each side of the equation to get:
%
% [v1.' v2.'][x_1; x_2] = v3'
%
% which is the form Ax = b. In Matlab we solve that as x = A\b (
R =

     2


rows =

     3

x = [v1.' v2.']\v3.'

x(1)*v1 + x(2)*v2
v3
% you can see that v3 = 2v1 - 3v2, illustrating that v3 is not linearly
% independent of v1 and v2.
x =

    2.0000
   -3.0000


ans =

   12.0000    3.0000    0.0000  -19.0000    8.0000  -11.0000


v3 =

    12     3     0   -19     8   -11

Problem set 7.4 #17

v1 = [0.2 1.2 5.3 2.8 1.6];
v2 = [4.3 3.4 0.9 2.0 -4.3];

rank([v1; v2])
% the rank is equal to the number of rows, so these vectors are linearly
% independent. You could also see that by inspection since the signs of the
% last element are different. there is no way to convert v1 to v2 by simple
% scaling.
ans =

     2

Near deficient rank

the rank command roughly works in the following way: the matrix is converted to a reduced row echelon form, and then the number of rows that are not all equal to zero are counted. Matlab uses a tolerance to determine what is equal to zero. If there is uncertainty in the numbers, you may have to define what zero is, e.g. if the absolute value of a number is less than 1e-5, you may consider that close enough to be zero. The default tolerance is usually very small, of order 1e-15.

A = [[1 2 3];
    [0 2 3];
    [0 0 1e-6]];

rank(A)
% matlab considers this matrix to have a full rank of 3 because the default
% tolerance in this case is 2.7e-15.
ans =

     3

rank with tolerance

If we believe that any number less than 1e-5 is practically equivalent to zero, we can use that information to compute the rank like this.

tolerance = 1e-5;
rank(A,tolerance)
% now the A matrix has a rank of only 2.
ans =

     2

Application to independent chemical reactions.

reference: Exercise 2.4 in Chemical Reactor Analysis and Design Fundamentals by Rawlings and Ekerdt.

The following reactions are proposed in the hydrogenation of bromine:

Let this be our species vector: v = [H2 H Br2 Br HBr]^T

the reactions are then defined by M*v where M is a stoichometric matrix in which each row represents a reaction with negative stoichiometric coefficients for reactants, and positive stoichiometric coefficients for products. A stoichiometric coefficient of 0 is used for species not participating in the reaction.

%    [H2  H Br2 Br HBr]
M = [[-1  0 -1  0  2];  % H2 + Br2 == 2HBR
     [ 0  0 -1  2  0];  % Br2 == 2Br
     [-1  1  0 -1  1];  % Br + H2 == HBr + H
     [ 0 -1 -1  1  1];  % H + Br2 == HBr + Br
     [ 1 -1  0  1  -1];  % H + HBr == H2 + Br
     [ 0  0  1 -2  0]]; % 2Br == Br2

rank(M)

% 6 reactions are given, but the rank of the matrix is only 3. so there
% are only four independent reactions. You can see that reaction 6 is just
% the opposite of reaction 2, so it is clearly not independent. Also,
% reactions 3 and 5 are just the reverse of each other, so one of them can
% also be eliminated. finally, reaction 4 is equal to reaction 1 minus
% reaction 3.
ans =

     3

choosing independent reactions

We can identify independent reactions by examining the reduced row echelon form of the matrix where the reactions are in the columns rather than rows. That is simply the transpose of the M matrix above. The columns with leading ones correspond to the reactions that can form a basis, i.e. the independent reactions.

rref(M')
% this shows columns 1,2,3 have leading ones, indicating the corresponding
% reactions are a suitable basis for all the reactions. If that is true,
% then we should be able to find solutions to the following linear
% equation: basis*x_i = reaction_i
ans =

     1     0     0     1     0     0
     0     1     0     0     0    -1
     0     0     1    -1    -1     0
     0     0     0     0     0     0
     0     0     0     0     0     0

basis = transpose(M(1:3,:)); % this is rows 1-3 of the M matrix

reaction_4 = M(4,:).';
reaction_5 = M(5,:).';
reaction_6 = M(6,:).';

x_4 = basis\reaction_4
x_5 = basis\reaction_5
x_6 = basis\reaction_6

% x_4, x_5 and x_6 are all integers, which means reactions 4, 5 and 6 are
% linear combinations of reactions 1, 2 and 3. As pointed out above, x_4
% shows reaction 4 to be reaction 1 - reaction 3; x_5 shows reaction 5 is
% -reaction 3; and x_6 shows reaction 6 is minus reaction 4.
x_4 =

    1.0000
    0.0000
   -1.0000


x_5 =

   -0.0000
    0.0000
   -1.0000


x_6 =

   -0.0000
   -1.0000
    0.0000

lets also demonstrate that reaction 1 is not a linear combination of reactions 2 and 3.

reaction_1 = M(1,:).';
x_1 = basis\reaction_1
% you can see the coefficients for reactions 2 and 3 are equal to zero,
% indicating reaction 1 is linearly independent of reactions 2 and 3.
x_1 =

    1.0000
    0.0000
    0.0000

Related posts

transposition rules

solving linear equations

% categories: Linear algebra
% tags: math, reaction engineering

% post_id = 640; %delete this line to force new post;
Read and Post Comments

polynomials in matlab

| categories: basic matlab | View Comments

polynomials

Contents

polynomials in matlab

polynomials can be represented as a vector of coefficients
4*x^3 + 3*x^2 -2*x + 10 = 0
can be represented as [4 3 -2 10]
ppar = [4 3 -2 10];

% we can evaluate the polynomial with the polyval command, e.g. to evaluate
% at x=3
polyval(ppar, 3)
ans =

   139

compare to

x=3;
4*x^3 + 3*x^2 -2*x + 10
% they are the same
ans =

   139

polynomial manipulations

matlab makes it easy to get the derivative and integral of a polynomial.

Consider:

$y = 2x^2 - 1$

ppar = [2 0 -1];

polynomial derivatives

$\frac{dy}{dx} = 4 x$

dpar = polyder(ppar)
% evaluate the derivative at x = 2
polyval(dpar,2)
dpar =

     4     0


ans =

     8

polynomial integrals

$\int y(x)dx = \frac{2}{3} x^3 - x + C$

We assume $C=0$.

ipar = polyint(ppar)
% note that the integration constant is assumed to be zero. If it is not
% zero, use POLYINT(P,K) where K is the constant of integration.
%
% Compute the integral of the polynomial from 2 to 4
polyval(ipar,4) - polyval(ipar,2)
% analytically:
2/3*(4^3 - 2^3) + (-4 - (-2))
ipar =

    0.6667         0   -1.0000         0


ans =

   35.3333


ans =

   35.3333

getting the roots of a polynomial

roots are the x-values that make the polynomial equal to zero.

roots(ppar)

% the analytical solutions are +- sqrt(1/2)

% note that imaginary roots exist, e.g. x^2 + 1 = 0 has two roots, +-i
ppar = [1 0 1]
roots(ppar)
ans =

    0.7071
   -0.7071


ppar =

     1     0     1


ans =

        0 + 1.0000i
        0 - 1.0000i

application in thermodynamics

we need to find the volume that solves the van der waal equation:

$$f(V) = V^3 - \frac{pnb + nRT}{p}V^2 + \frac{n^2a}{p}V - \frac{n^3ab}{p} = 0$$

where a and b are constants.

% numerical values of the constants
a = 3.49e4;
b = 1.45;
p = 679.7;
T = 683;
n = 1.136;
R = 10.73;

% The van der waal equation is a polynomial
%  V^3 - (p*n*b+n*R*T)/p*V^2 + n^2*a/p*V - n^3*a*b/p = 0

%use commas for clarity in separation of terms
ppar = [1, -(p*n*b+n*R*T)/p, n^2*a/p,  -n^3*a*b/p];
roots(ppar)

% note that only one root is real. In this case that means there is only
% one phase present.

% categories: Basic matlab
% tags: math, thermodynamics
ans =

   5.0943          
   4.4007 + 1.4350i
   4.4007 - 1.4350i

Read and Post Comments

« Previous Page -- Next Page »