Peak finding in Raman spectroscopy
August 27, 2012 at 03:39 PM | categories: data analysis | View Comments
Contents
Peak finding in Raman spectroscopy
John Kitchin
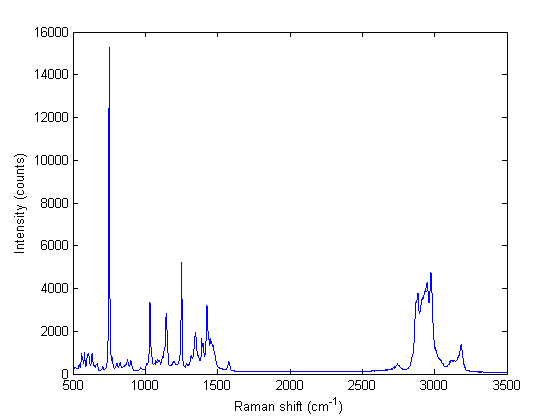
Raman spectroscopy is a vibrational spectroscopy. The data typically comes as intensity vs. wavenumber, and it is discrete. Sometimes it is necessary to identify the precise location of a peak. In this post, we will use spline smoothing to construct an interpolating function of the data, and then use fminbnd to identify peak positions.
clear all; close all
Read and plot the raw data
[w,i] = textread('raman.txt');

plot(w,i)
xlabel('Raman shift (cm^{-1})')
ylabel('Intensity (counts)')
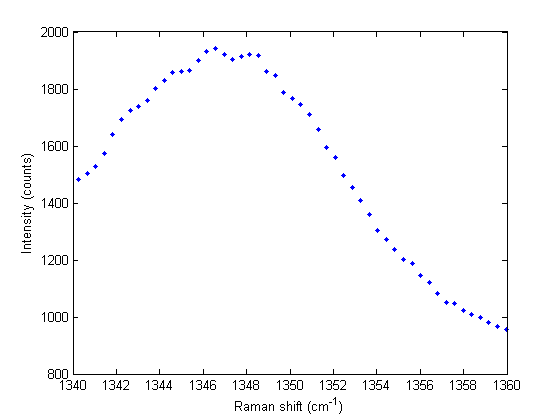
Narrow to the region of interest
We will focus on the peaks between 1340 and 1360 cm^-1.
ind = w > 1340 & w < 1360;
w1 = w(ind);
i1 = i(ind);
figure(2)
plot(w1, i1,'b. ')
xlabel('Raman shift (cm^{-1})')
ylabel('Intensity (counts)')
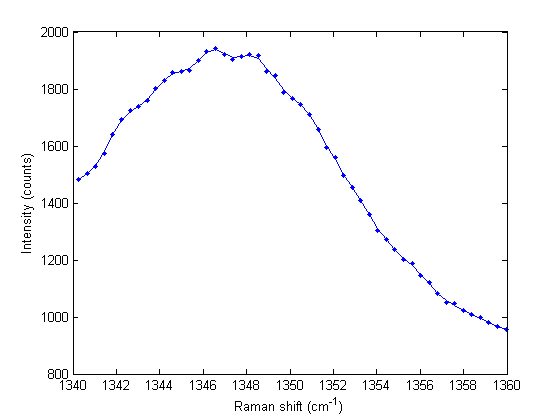
Generate the spline
The last parameter in csaps determines the amount of smoothing. Closer to 1.0 is less smoothing.
pp = csaps(w1, i1,.99)
hold all
plot(w1, ppval(pp,w1))
pp =

      form: 'pp'
    breaks: [1x51 double]
     coefs: [50x4 double]
    pieces: 50
     order: 4
       dim: 1
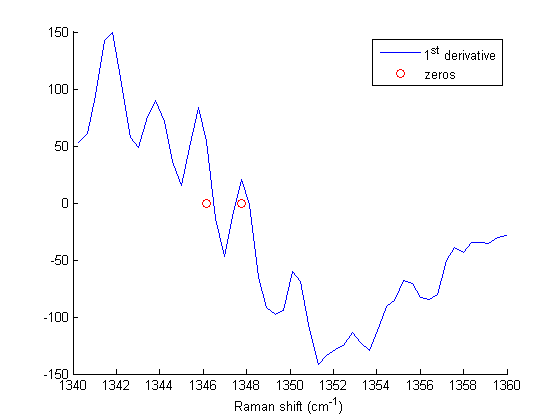
Find all the zeros in the first derivative
We will brute force this by looking for sign changes in the derivative vector evaluated at all the points of the original data
d1 = fnder(pp, 1); % first derivative
s = ppval(d1, w1);
s(s >= 0) = 1;
s(s < 0) = 0;

% where diff = -1 indicates a transition from positive slope to
% negative slope, which is a maximum. These are approximate locations
% of the zeros
z = find(diff(s) == -1);
Make an interpolating function to find the minima
to use fminbnd we need a function. we make a function handle that is the negative of the main function, so that the peak locations are located at minima. interpolating function handle
f = @(xx) -ppval(pp,xx);

% now loop through each value found in z to find the minimum over the
% interval around each zero.
x = zeros(size(z));
for i=1:length(x)
    lowerbound = w1(z(i)-5);
    upperbound = w1(z(i)+5);
    x(i) = fminbnd(f,lowerbound,upperbound);
end
Plot the derivatives and peaks found
figure
hold all
plot(w1, ppval(d1,w1))
plot(w1(z), ppval(d1, x),'ro ')

xlabel('Raman shift (cm^{-1})')
legend('1^{st} derivative', 'zeros')
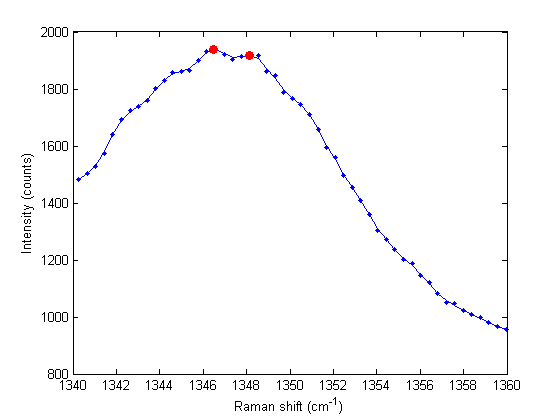
Label the peaks in the original data
figure(2)
plot(x, ppval(pp,x), 'ro','markerfacecolor','r')

% print some offset labels
for i=1:length(x)
    sprintf('%1.1f cm^{-1}',x(i))
end
ans =

1346.5 cm^{-1}


ans =

1348.1 cm^{-1}
Discussion
In the end, we have illustrated how to construct a spline smoothing interpolation function and to find maxima in the function, including generating some initial guesses. There is more art to this than you might like, since you have to judge how much smoothing is enough or too much. With too much, you may smooth peaks out. With too little, noise may be mistaken for peaks.
done
% categories: data analysis
% post_id = 2007; %delete this line to force new post;
% permaLink = http://matlab.cheme.cmu.edu/2012/08/27/peak-finding-in-raman-spectroscopy/;