Fit a line to numerical data
August 04, 2011 at 08:36 PM | categories: data analysis | View Comments
Fit a line to numerical data
John Kitchin
Contents
Problem statement
fit a line to this data
x = [0 0.5 1 1.5 2.0 3.0 4.0 6.0 10];
y = [0 -0.157 -0.315 -0.472 -0.629 -0.942 -1.255 -1.884 -3.147];
polyfit(x,y,n) where n is the polynomial order, n=1 for a line
note that the output of this command is a "polynomial in Matlab. See polynomials for more details.
p = polyfit(x,y,1)

slope=p(1)
intercept=p(2)
p =

   -0.3145    0.0006


slope =

   -0.3145


intercept =

  6.2457e-004
we can calculate the fitted values with polyval
fittedy = polyval(p,x);
or by hand
fittedy2 = slope*x + intercept;
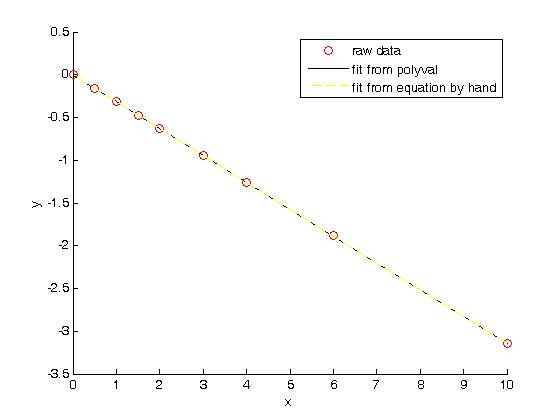
plot each method for comparison
figure(1)
hold on
plot(x,y,'ro','DisplayName','raw data')
plot(x,fittedy,'k-','DisplayName','fit from polyval')
plot(x,fittedy2,'y-- ','DisplayName','fit from equation by hand')
xlabel('x')
ylabel('y')
legend show
% These should be indistinguishable. We use combinations of symbols with no
% lines, solid lines, and dashed lines to see that all curves are the same.

% categories: Data analysis
% tags: math
% post_id = 650; %delete this line to force new post;