Smooth transitions between discontinuous functions

| categories: miscellaneous, nonlinear algebra | View Comments

transition_discontinuous_functions

Contents

Smooth transitions between discontinuous functions

John Kitchin

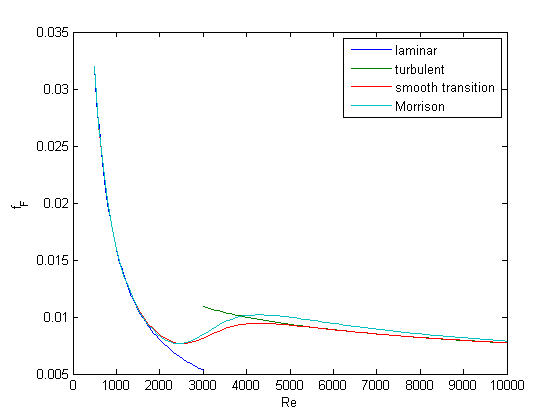
In Post 1280 we used a correlation for the Fanning friction factor for turbulent flow in a pipe. For laminar flow (Re < 3000), there is another correlation that is commonly used: $f_F = 16/Re$. Unfortunately, the correlations for laminar flow and turbulent flow have different values at the transition that should occur at Re = 3000. This discontinuity can cause a lot of problems for numerical solvers that rely on derivatives.

Today we examine a strategy for smoothly joining these two functions.

function main
clear all; close all; clc

Friction factor correlations

    function f = fF_laminar(Re)
        f = 16./Re;
    end

    function f = fF_turbulent(Re)
        % Nikuradse correlation for turbulent flow
        function f = internalfunc(Re)
            f = fzero(@(f) 1/sqrt(f) - (4.0*log10(Re*sqrt(f))-0.4), 0.01);
        end
        % this makes the function act as if it were vectorized, so we can
        % get an array of friction factors
        f = arrayfun(@internalfunc,Re);
    end

Plot the correlations

Re1 = linspace(500,3000);
f1 = fF_laminar(Re1);

Re2 = linspace(3000,10000);
f2 = fF_turbulent(Re2);

figure(1)
plot(Re1,f1,Re2,f2)
xlabel('Re')
ylabel('f_F')
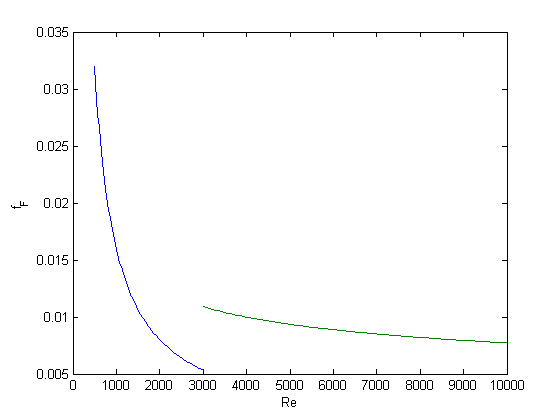
You can see the discontinuity at Re = 3000. What we need is a method to join these two functions smoothly. We can do that with a sigmoid function.

Sigmoid functions

A sigmoid function smoothly varies from 0 to 1 according to the equation: $\sigma(x) = \frac{1}{1 + e^{-(x-x0)/\alpha}}$. The transition is centered on $x0$, and $\alpha$ determines the width of the transition.

x = linspace(-4,4);
y = 1./(1+exp(-x/0.1));
figure(2)
plot(x,y)
xlabel('x'); ylabel('y'); title('\sigma(x)')
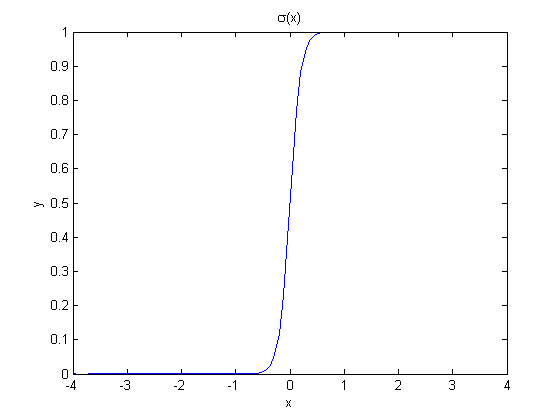
If we have two functions, $f_1(x)$ and $f_2(x)$ we want to smoothly join, we do it like this: $f(x) = (1-\sigma(x))f_1(x) + \sigma(x)f_2(x)$. There is no formal justification for this form of joining, it is simply a mathematical convenience to get a numerically smooth function. Other functions besides the sigmoid function could also be used, as long as they smoothly transition from 0 to 1, or from 1 to zero.

Smoothly transitioning function to estimate friction factor

    function f = fanning_friction_factor(Re)
        % combined, continuous correlation for the fanning friction factor.
        % the alpha parameter is chosen to provide the desired smoothness.
        % The transition region is about +- 4*alpha. The value 450 was
        % selected to reasonably match the shape of the correlation
        % function provided by Morrison (see last section of this file)
        sigma =  1./(1+exp(-(Re - 3000)/450));
        f = (1-sigma).*fF_laminar(Re) + sigma.*fF_turbulent(Re);
    end

Re = linspace(500,10000);
f = fanning_friction_factor(Re);

figure(1); hold all
plot(Re,f)
xlabel('Re')
ylabel('f_F')
legend 'laminar' 'turbulent' 'smooth transition'
Exiting fzero: aborting search for an interval containing a sign change
    because complex function value encountered during search.
(Function value at -0.0028 is -5.2902-21.627i.)
Check function or try again with a different starting value.
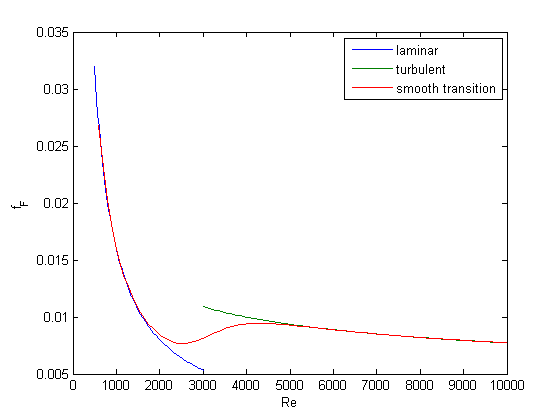
You can see that away from the transition the combined function is practically equivalent to the original two functions. That is because away from the transition the sigmoid function is 0 or 1. Near Re = 3000 is a smooth transition from one curve to the other curve.

Morrison derived a single function for the friction factor correlation over all Re: $f = \frac{0.0076\left(\frac{3170}{Re}\right)^{0.165}}{1 + \left(\frac{3171}{Re}\right)^{7.0}} + \frac{16}{Re}$. Here we show the comparison with the approach used above. The friction factor differs slightly at high Re, becauase Morrison's is based on the Prandlt correlation, while the work here is based on the Nikuradse correlation. They are similar, but not the same.

h = plot(Re,16./Re + (0.0076*(3170./Re).^0.165)./(1 + (3170./Re).^7))

% Append an entry to the legend
[LEGH,OBJH,OUTH,OUTM] = legend;
% Add object with new handle and new legend string to legend
legend([OUTH;h],OUTM{:},'Morrison')
h =

  415.0735
Summary

The approach demonstrated here allows one to smoothly join two discontinuous functions that describe physics in different regimes, and that must transition over some range of data. It should be emphasized that the method has no physical basis, it simply allows one to create a mathematically smooth function, which could be necessary for some optimizers or solvers to work.

end % main

% categories: Miscellaneous, nonlinear algebra
% tags: Fluids
Read and Post Comments

compute pipe diameter

| categories: nonlinear algebra | View Comments

compute pipe diameter

compute pipe diameter

A heat exchanger must handle 2.5 L/s of water through a smooth pipe with length of 100 m. The pressure drop cannot exceed 103 kPa at 25 degC. Compute the minimum pipe diameter required for this application.

Adapted from problem 8.8 in Problem solving in chemical and Biochemical Engineering with Polymath, Excel, and Matlab. page 303.

Contents

Solution

We need to estimate the Fanning friction factor for these conditions so we can estimate the frictional losses that result in a pressure drop for a uniform, circular pipe. The frictional forces are given by $F_f = 2f_F \frac{\Delta L v^2}{D}$, and the corresponding pressure drop is given by $\Delta P = \rho F_f$. In these equations, $\rho$ is the fluid density, $v$ is the fluid velocity, $D$ is the pipe diameter, and $f_F$ is the Fanning friction factor. The average fluid velocity is given by $v = \frac{q}{\pi D^2/4}$.

For laminar flow, we estimate $f_F = 16/Re$, which is a linear equation, and for turbulent flow ($Re > 2100$) we have the implicit equation $\frac{1}{\sqrt{f_F}}=4.0 \log(Re \sqrt{f_F})-0.4$. Of course, we define $Re = \frac{D v\rho}{\mu}$ where $\mu$ is the viscosity of the fluid.

It is known that $\rho(T) = 46.048 + 9.418 T -0.0329 T^2 +4.882\times10^{-5}-2.895\times10^{-8}T^4$ and $\mu = \exp\left({-10.547 + \frac{541.69}{T-144.53}}\right)$ where $\rho$ is in kg/m^3 and $\mu$ is in kg/(m*s).

function main
clear all; close all

u = cmu.units;

T = u.degC(25);
Q = 2.5*u.L/u.s;
deltaP = 103*u.kPa;
deltaL = 100*u.m;

% Note these correlations expect dimensionless T, where the magnitude
% of T is in K
rho = @(T) (46.048 + 9.418*T -0.0329*T^2 +4.882e-5*T^3-2.895e-8*T^4)*u.kg/u.m^3;
mu = @(T) exp(-10.547 + 541.69/(T-144.53))*u.Pa*u.s;

    function fF = fanning_friction_factor(Re)
        if Re < 2100
            error('Flow is probably not turbulent')
        end
        % solve the Nikuradse correlation to get the friction factor
        fz = @(f) 1/sqrt(f) - (4.0*log10(Re*sqrt(f))-0.4);
        fF = fzero(fz, 0.01);
    end

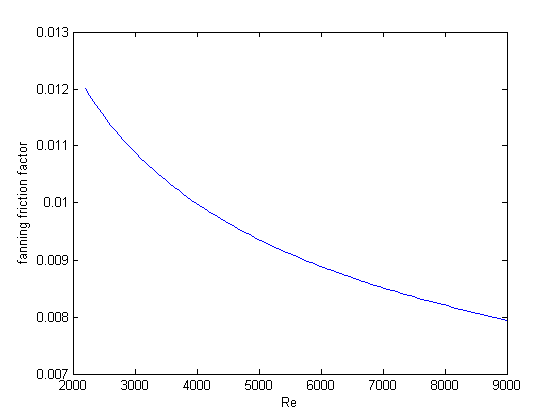
plot fanning friction factor

Re = linspace(2200,9000);
f = arrayfun(@fanning_friction_factor,Re);
plot(Re,f)
xlabel('Re')
ylabel('fanning friction factor')
% You can see why we use 0.01 as an initial guess for solving for the
% Fanning friction factor; it falls in the middle of ranges possible
% for these Re numbers.

Solve the problem

The aim is to find $D$ that solves: $ \Delta p = \rho 2 f_F \frac{\Delta L v^2}{D}$. This is a nonlinear equation in $D$, since D affects the fluid velocity, the Re, and the Fanning friction factor. Here is the function that we need to solve:

    function z = objective(D)
        v = Q/(pi*D^2/4);
        Re = D*v*rho(double(T))/mu(double(T));

        fF = fanning_friction_factor(Re);

        z = deltaP - 2*fF*rho(double(T))*deltaL*v^2/D;
    end

D = fzero(@objective,0.04*u.m)
fprintf('The minimum pipe diameter is %s\n', D.as(u.mm,'%1.2f'))
0.0389653*m
The minimum pipe diameter is 38.97*mm

Any pipe diameter smaller than that value will result in a larger pressure drop at the same volumetric flow rate, or a smaller volumetric flowrate at the same pressure drop. Either way, it will not meet the design specification.

Notes:

If D happened to be large enough to result in laminar flow, this solution would break down, because we didn't define a fanning friction factor correlation for laminar flow. We could do that in our fanning friction factor function, but some care should be taken to ensure it is continuous.

end % main

% categories: Nonlinear algebra
% tags: fluids
Read and Post Comments

Using Java inside Matlab

| categories: data analysis, miscellaneous | View Comments

Using Java inside Matlab

Using Java inside Matlab

John Kitchin

Matlab is pretty good, but it doesn't do everything, and you might not always have the toolbox that contains the function you want. There might even be an excellent open-source software library that can't be included in Matlab, but can be used within Matlab.

Matlab has excellent support for using Java with minimal effort. A repository of numerical libraries can be found at http://math.nist.gov/javanumerics/. In this example we install the commons-math Java library, and show an example of using it.

Contents

Here are a few things the commons libary can do:

  Computing means, variances and other summary statistics for a list of numbers
  Fitting a line to a set of data points using linear regression
  Finding a smooth curve that passes through a collection of points (interpolation)
  Fitting a parametric model to a set of measurements using least-squares methods
  Solving equations involving real-valued functions (i.e. root-finding)
  Solving systems of linear equations
  Solving Ordinary Differential Equations
  Minimizing multi-dimensional functions
  Generating random numbers with more restrictions (e.g distribution, range) than what is possible using the JDK
  Generating random samples and/or datasets that are "like" the data in an input file
  Performing statistical significance tests
  Miscellaneous mathematical functions such as factorials, binomial coefficients and "special functions" (e.g. gamma, beta functions)

Many of them duplicate features in Matlab, but they may implement different algorithms, or more convenient syntax.

clear all; clc; close all

download and install

These two commands only need to be run once, so comment them out after you run them.

%urlwrite('http://mirror.metrocast.net/apache/commons/math/binaries/commons-math-2.2.zip','commons-math-2.2.zip')
%unzip('commons-math-2.2.zip')

We have to add the jar file to the javaclasspath so we can use it.

javaaddpath([pwd '/commons-math-2.2/commons-math-2.2.jar'])

linear regression with Matlab

Note that the regress command is part of the Statistics toolbox, which is great if you have it! We show here how to do it, so we also have something to compare the Java result to.

x = [1 2 3 4 5]';
y = [3 5 7 14 11]';

[b bint]= regress(y,[x.^0 x])
b =

    0.5000
    2.5000


bint =

   -7.5615    8.5615
    0.0694    4.9306

Now the Java way

Documentation Examples

The first thing we do is import the Java library. the * at the end indicates that all classes should be imported.

import org.apache.commons.math.stat.regression.*

Create a class instance.

The SimpleRegression class has several methods that we can call later to perform analysis

regression = SimpleRegression();
methods(regression)
Methods for class org.apache.commons.math.stat.regression.SimpleRegression:

SimpleRegression            getSlope                    
addData                     getSlopeConfidenceInterval  
clear                       getSlopeStdErr              
equals                      getSumSquaredErrors         
getClass                    getTotalSumSquares          
getIntercept                hashCode                    
getInterceptStdErr          notify                      
getMeanSquareError          notifyAll                   
getN                        predict                     
getR                        toString                    
getRSquare                  wait                        
getRegressionSumSquares     
getSignificance             

add the data

regression.addData([x y]);

get the slope and some statistics of the slope

m = regression.getSlope()
mstd = regression.getSlopeStdErr()
mint = regression.getSlopeConfidenceInterval(); % 95% by default
[m - mint  m + mint] % this is the 95% interval
m =

    2.5000


mstd =

    0.7638


ans =

    0.0694    4.9306

Note the confidence interval is greater than +- 2*sigma. This is because of the student-t table multiplier on the standard error due to the small number

get the intercept and some statistics

note there is not getInterceptConfidenceInterval method for some reason!

b = regression.getIntercept()
bstd = regression.getInterceptStdErr()

sprintf('R^2 = %1.3f', regression.getRSquare())
b =

    0.5000


bstd =

    2.5331


ans =

R^2 = 0.781

Summary

It takes more lines of code to get the Java version of linear regression, but you have finer control over what data you get, and what order you get it in. You still have to read the Java documentation to learn the command syntax, and debugging can be somewhat more difficult than straight Matlab. However, the integration of Java into Matlab opens some interesting possibilities to extend Matlab's functionality.

% categories: Miscellaneous, data analysis
Read and Post Comments

Create a word document from Matlab

| categories: miscellaneous | View Comments

Create a word document from Matlab

Create a word document from Matlab

John Kitchin

Have you been wondering how to create a word document from Matlab that doesn't require the publish button? Below we look at a way to use Matlab for COM automation to create a word document and put text in it. I adapted the Perl code at http://www.adp-gmbh.ch/perl/word.html for this example. There is hardly any interesting output from any of these commands,

Contents

Create the word application

and make it visible

word = actxserver('Word.Application');
word.Visible = 1;

Add a new document and get the current selection

document = word.Documents.Add;
selection = word.Selection;

add text and paragraphs

selection.TypeText('Hello world. ');
selection.TypeText('My name is Professor Kitchin');
selection.TypeParagraph;
selection.TypeText('How are you today?');
selection.TypeParagraph;

Setting a Header

selection.TypeText('Big Finale');
selection.Style='Heading 1';
selection.TypeParagraph;

Modifying Header properties

H1 = document.Styles.Item('Heading 1')
H1.Font.Name = 'Garamond';
H1.Font.Size = 20;
H1.Font.Bold = 1;
H1.Font.TextColor.RGB=60000; % some ugly color green

selection.TypeParagraph
selection.TypeText('That is all for today!')
 
H1 =
 
	Interface.0002092C_0000_0000_C000_000000000046

Now we save the document

document.SaveAs2([pwd '/test.docx']);
word.Quit();

Summary

That is it! I wouldn't call this extra convenient, but if you have a need to automate the production of Word documents from a program, this is an approach that you can use. You may find http://msdn.microsoft.com/en-us/library/kw65a0we%28v=vs.80%29.aspx a helpful link for documentation of what you can do.

%  download test.docx 

% categories: Miscellaneous
Read and Post Comments

Linear programming example with inequality constraints

| categories: optimization | View Comments

Linear programming example with inequality constraints

Linear programming example with inequality constraints

John Kitchin

adapted from http://www.matrixlab-examples.com/linear-programming.html which solves this problem with fminsearch.

Let's suppose that a merry farmer has 75 roods (4 roods = 1 acre) on which to plant two crops: wheat and corn. To produce these crops, it costs the farmer (for seed, water, fertilizer, etc. ) $120 per rood for the wheat, and $210 per rood for the corn. The farmer has $15,000 available for expenses, but after the harvest the farmer must store the crops while awaiting favorable or good market conditions. The farmer has storage space for 4,000 bushels. Each rood yields an average of 110 bushels of wheat or 30 bushels of corn. If the net profit per bushel of wheat (after all the expenses) is $1.30 and for corn is $2.00, how should the merry farmer plant the 75 roods to maximize profit?

Let x be the number of roods of wheat planted, and y be the number of roods of corn planted. The profit function is: P = (110)($1.3)x + (30)($2)y = 143x + 60y

There are some constraint inequalities, specified by the limits on expenses, storage and roodage. They are:

$120x + $210y <= $15000 % The total amount spent can't exceed the amount the farm has.

110x + 30y <= 4000 % The amount generated should not exceed storage space.

x + y <= 75 % We can't plant more space than we have.

0 <= x and 0 <= y % all amounts of planted land must be positive.

Contents

Function to minimize

To solve this problem, we cast it as a linear programming problem, which minimizes a function f(X) subject to some constraints. We create a proxy function for the negative of profit, which we seek to minimize.

f = -143*x - 60*y

f = [-143 -60];

Inequality constraints

We express our constraints in the form A*x <= b

120x + 210y <= 15000
110x + 30y <= 4000
x + y <= 75
A = [120 210
    110 30
    1 1];
b = [15000
    4000
    75];

Lower bounds

Finally, we express the lower bounds on the unknowns. 0 <= x and 0 <= y

lb = [0
      0];

Finally solve the problem

[X,fval,exitflag,output,lambda] = linprog(f,A,b,[],[],lb);

fprintf('We should plant %1.2f roods of wheat.\n',X(1))
fprintf('We should plant %1.2f roods of corn.\n',X(2))
profit = -f*X;
fprintf('The maximum profit we can earn is $%1.2f.',profit)

% categories: optimization
Optimization terminated.
We should plant 21.88 roods of wheat.
We should plant 53.12 roods of corn.
The maximum profit we can earn is $6315.62.
Read and Post Comments

« Previous Page -- Next Page »