Model selection

| categories: data analysis | View Comments

Model selection

Model selection

adapted from http://www.itl.nist.gov/div898/handbook/pmd/section4/pmd44.htm

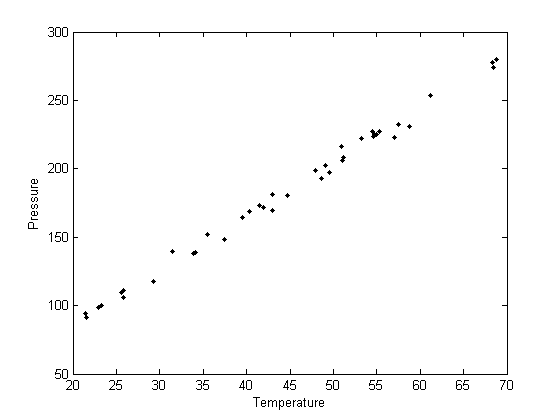
In this example, we show some ways to choose which of several models fit data the best. We have data for the total pressure and temperature of a fixed amount of a gas in a tank that was measured over the course of several days. We want to select a model that relates the pressure to the gas temperature.

The data is stored in a text file download PT.txt , with the following structure

Contents

 Run          Ambient                            Fitted
 Order  Day  Temperature  Temperature  Pressure    Value    Residual
  1      1      23.820      54.749      225.066   222.920     2.146

We need to read the data in, and perform a regression analysis on columns 4 and 5.

clc; clear all; close all

Read in the data

all the data is numeric, so we read it all into one matrix, then extract out the relevant columns

data = textread('PT.txt','','headerlines',2);
run_order = data(:,1);
run_day = data(:,2);
ambientT = data(:,3);
T = data(:,4);
P = data(:,5);
plot(T,P,'k. ')
xlabel('Temperature')
ylabel('Pressure')
Fit a line to the data for P(T) = a + bT

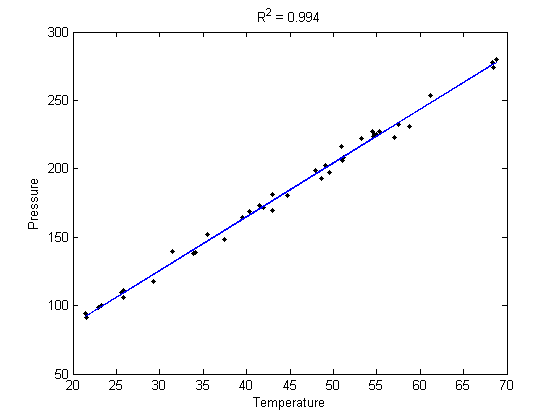
It appears the data is roughly linear, and we know from the ideal gas law that PV = nRT, or P = nR/V*T, which says P should be linearly correlated with V. Note that the temperature data is in degC, not in K, so it is not expected that P=0 at T = 0. let X = T, and Y = P for the regress syntax. The regress command expects a column of ones for the constant term so that the statistical tests it performs are valid. We get that column by raising the independent variable to the zero power.

X = [T.^0 T]; % [1 T1]
Y = P;
alpha = 0.05; % specifies the 95% confidence interval

[b bint] = regress(Y,X,alpha)
b =

    7.7490
    3.9301


bint =

    2.9839   12.5141
    3.8275    4.0328

Note that the intercept is not zero, although, the confidence interval is fairly large, it does not include zero at the 95% confidence level.

Calculate R^2 for the line

The R^2 value accounts roughly for the fraction of variation in the data that can be described by the model. Hence, a value close to one means nearly all the variations are described by the model, except for random variations.

ybar = mean(Y);
SStot = sum((Y - ybar).^2);
SSerr = sum((Y - X*b).^2);
R2 = 1 - SSerr/SStot;
sprintf('R^2 = %1.3f',R2)
ans =

R^2 = 0.994

Plot the data and the fit

plot(T,P,'k. ',T,X*b,'b -')
xlabel('Temperature')
ylabel('Pressure')
title(sprintf('R^2 = %1.3f',R2))
Evaluating the model

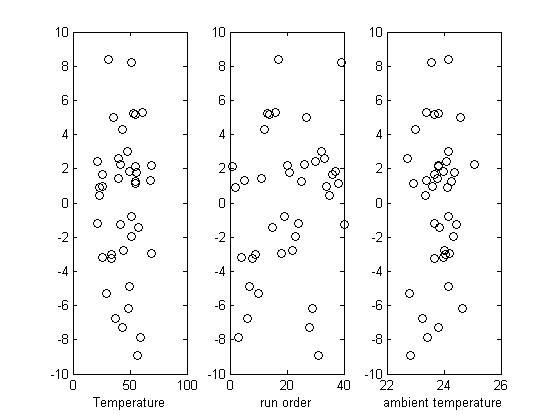
The fit looks good, and R^2 is near one, but is it a good model? There are a few ways to examine this. We want to make sure that there are no systematic trends in the errors between the fit and the data, and we want to make sure there are not hidden correlations with other variables.

Plot the residuals

the residuals are the error between the fit and the data. The residuals should not show any patterns when plotted against any variables, and they do not in this case.

residuals = P - X*b;
figure
hold all
subplot(1,3,1)
plot(T,residuals,'ko')
xlabel('Temperature')

subplot(1,3,2)
plot(run_order,residuals,'ko ')
xlabel('run order')

subplot(1,3,3)
plot(ambientT,residuals,'ko')
xlabel('ambient temperature')
check for correlations between residuals

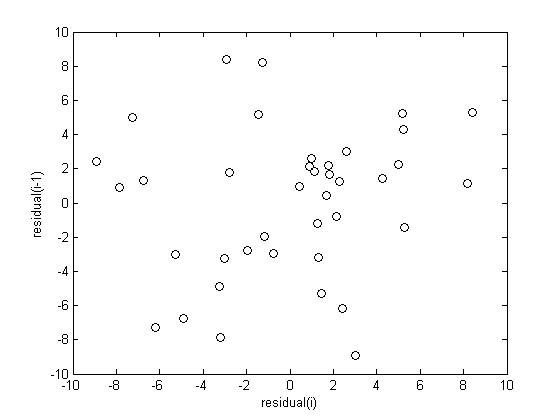
We assume all the errors are uncorrelated with each other. We use a lag plot, where we plot residual(i) vs residual(i-1), i.e. we look for correlations between adjacent residuals. This plot should look random, with no correlations if the model is good.

figure
plot(residuals(2:end),residuals(1:end-1),'ko')
xlabel('residual(i)')
ylabel('residual(i-1)')
Alternative models

Lets consider a quadratic model instead.

X = [T.^0 T.^1 T.^2];
Y = P;
alpha = 0.05; % 95% confidence interval

[b bint] = regress(Y,X,alpha)
b =

    9.0035
    3.8667
    0.0007


bint =

   -4.7995   22.8066
    3.2046    4.5288
   -0.0068    0.0082

You can see that the 95% confidence interval on the constant and $T^2$ includes zero, so adding a parameter does not increase the goodness of fit. This is an example of overfitting the data, but it also makes you question whether the constant is meaningful in the linear model. The regress function expects a constant in the model, and the documentation says leaving it out

Alternative models

Lets consider a model with intercept = 0, P = alpha*T

X = [T];
Y = P;
alpha = 0.05; % 95% confidence interval

[b bint] = regress(Y,X,alpha)
plot(T,P,'k. ',T,X*b,'b- ')
xlabel('Temperature')
ylabel('Pressure')
legend 'data' 'fit'

ybar = mean(Y);
SStot = sum((Y - ybar).^2);
SSerr = sum((Y - X*b).^2);
R2 = 1 - SSerr/SStot;
title(sprintf('R^2 = %1.3f',R2))
b =

    4.0899


bint =

    4.0568    4.1231
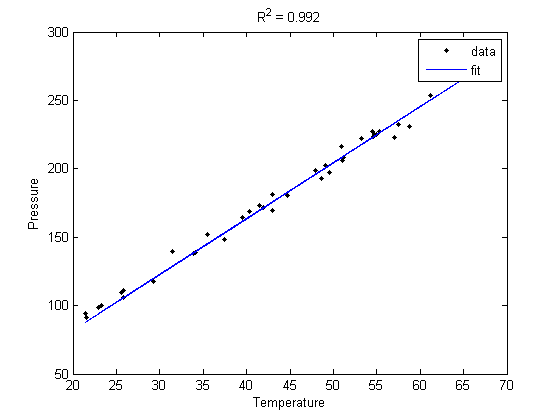
The fit is visually still good. and the R^2 value is only slightly worse.

plot residuals

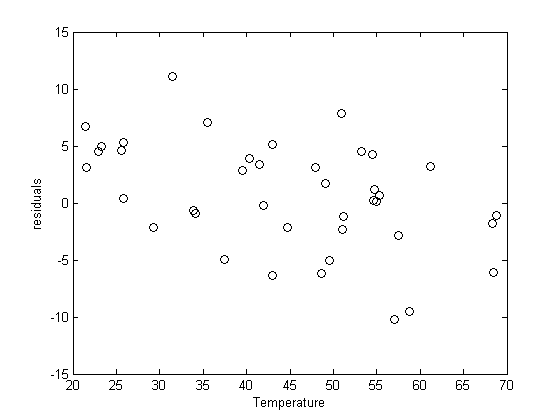
You can see a slight trend of decreasing value of the residuals as the Temperature increases. This may indicate a deficiency in the model with no intercept. For the ideal gas law in degC: $PV = nR(T+273)$ or $P = nR/V*T + 273*nR/V$, so the intercept is expected to be non-zero in this case. That is an example of the deficiency.

residuals = P - X*b;
figure
plot(T,residuals,'ko')
xlabel('Temperature')
ylabel('residuals')
'done'
% categories: data analysis
ans =

done

Read and Post Comments

Plane poiseuelle flow solved by finite difference

| categories: odes | View Comments

poiseuille_flow_finite_difference

Contents

Plane poiseuelle flow solved by finite difference

John Kitchin

http://www.physics.arizona.edu/~restrepo/475B/Notes/source/node24.html

solve a linear boundary value problem of the form: y'' = p(x)y' + q(x)y + r(x) with boundary conditions y(x1) = alpha and y(x2) = beta.

For this example, we resolve the plane poiseuille flow problem we previously solved in Post 878 with the builtin solver bvp5c, and in Post 1036 by the shooting method. An advantage of the approach we use here is we do not have to rewrite the second order ODE as a set of coupled first order ODEs, nor do we have to provide guesses for the solution.

we want to solve u'' = 1/mu*DPDX with u(0)=0 and u(0.1)=0. for this problem we let the plate separation be d=0.1, the viscosity $\mu = 1$, and $\frac{\Delta P}{\Delta x} = -100$.

clc; close all; clear all;

we define function handles for each term in the BVP.

we use the notation for y'' = p(x)y' + q(x)y + r(x)

p = @(x) 0;
q = @(x) 0;
r = @(x) -100;

define the boundary conditions

we use the notation y(x1) = alpha and y(x2) = beta

x1 = 0; alpha = 0;
x2 = 0.1; beta = 0;

define discretization

here we define the number of intervals to discretize the x-range over. You may need to increase this number until you see your solution no longer depends on the number of discretized points.

npoints = 10;

No user modification required below here

Below here is just the algorithm for solving the finite difference problem. To solve another kind of linear BVP, just modify the variables above according to your problem.

The idea behind the finite difference method is to approximate the derivatives by finite differences on a grid. See here for details. By discretizing the ODE, we arrive at a set of linear algebra equations of the form $A y = b$, where $A$ and $b$ are defined as follows.

To solve our problem, we simply need to create these matrices and solve the linear algebra problem.

% compute interval width
h = (x2-x1)/npoints;

% preallocate and shape the b vector and A-matrix
b = zeros(npoints-1,1);
A = zeros(npoints-1, npoints-1);
X = zeros(npoints-1,1);

now we populate the A-matrix and b vector elements

for i=1:(npoints-1)
    X(i,1) = x1 + i*h;

    % get the value of the BVP Odes at this x
    pi = p(X(i));
    qi = q(X(i));
    ri = r(X(i));

    if i == 1
        b(i) = h^2*ri-(1-h/2*pi)*alpha; % first boundary condition
    elseif i == npoints - 1
        b(i) = h^2*ri-(1+h/2*pi)*beta; % second boundary condition
    else
        b(i) = h^2*ri; % intermediate points
    end

    for j = 1:(npoints-1)
        if j == i % the diagonal
            A(i,j) = -2+h^2*qi;
        elseif j == i-1 % left of the diagonal
            A(i,j) = 1-h/2*pi;
        elseif j == i+1 % right of the diagonal
            A(i,j) = 1 + h/2*pi;
        else
            A(i,j) = 0; % off the tri-diagonal
        end
    end
end

solve the equations A*y = b for Y

Y = A\b;

construct the solution

the equations were only solved for X between x1 and x2, so we add the boundary conditions back to the solution on each side

x = [x1; X; x2];
y = [alpha; Y; beta];

plot the numerical solution

plot(x,y)
xlabel('distance between plates')
ylabel('fluid velocity')
% the analytical solution to this problem is known, and we can plot it on
% top of the numerical solution
hold all
mu = 1;
d = 0.1
x = linspace(0,0.1);
Pdrop = -100; % this is DeltaP/Deltax
u = -(Pdrop)*d^2/2/mu*(x/d-(x/d).^2);
plot(x,u,'r--')
d =

    0.1000

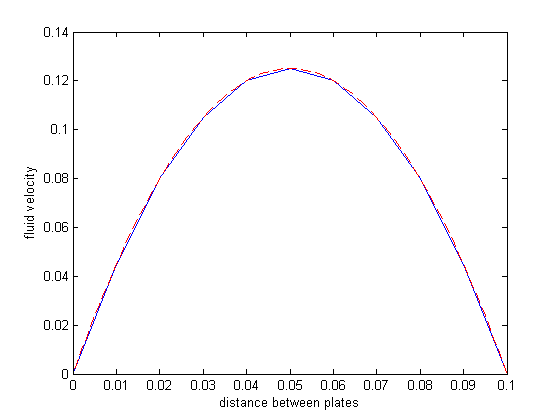
The two solutions agree. The advantages of this method over the shooting method (:postid:1036`) and builtin solver ( Post 878 ) are that you do not need to break the 2nd order ODE into a system of 1st order ODEs, and there is no "guessing" of the solution to get the solver started. Some disadvantages are the need to have a linear BVP in the form described at the beginning. If your BVP is nonlinear, you can't solve it with linear algebra! Another disadvantage is the amount of code we had to write. If you need to solve this kind of problem often, you probably would want to encapsulate the algorithm code into a reusable function.

'done'

% categories: ODEs
% tags: BVP

% post_id = 1193; %delete this line to force new post;
% permaLink = http://matlab.cheme.cmu.edu/2011/09/30/plane-poiseuelle-flow-solved-by-finite-difference/;
ans =

done

Read and Post Comments

Fitting a numerical ODE solution to data

| categories: data analysis | View Comments

fit_ode

Contents

Fitting a numerical ODE solution to data

function main
clc; clear all; close all

Suppose we know the concentration of A follows this differential equation: $\frac{dC_A}{dt} = -k C_A$, and we have the following data:

Lets make these column vectors

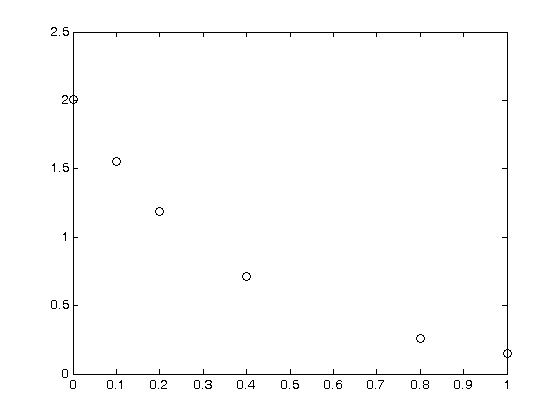
tspan = [0 0.1 0.2 0.4 0.8 1]';
Ca_data = [2.0081  1.5512  1.1903  0.7160  0.2562  0.1495]';
plot(tspan,Ca_data,'ko ')

In this case, one could solve the simple ODE, and transform the data to get a simple linear fit. Instead, we are going to develop a method to directly fit the ODE solution to the data.

parguess = [1.3]; % nonlinear fits need initial guesses
[pars, resid, J] = nlinfit(tspan,Ca_data,@myfunc,parguess)
pars =

    2.5889


resid =

         0
    0.0011
   -0.0062
    0.0031
    0.0031
   -0.0013


J =

         0
   -0.1550
   -0.2393
   -0.2852
   -0.2025
   -0.1508

the residuals are pretty low. J is a Jacobian, and we don't need to worry about it. It is used to estimate confidence intervals.

parameter confidence intervals

alpha = 0.05; % this is for 95% confidence intervals
pars_ci = nlparci(pars,resid,'jacobian',J,'alpha',alpha)

sprintf('The true value of k is between %1.2f and %1.2f at the 95%% confidence level',pars_ci)
pars_ci =

    2.5701    2.6077


ans =

The true value of k is between 2.57 and 2.61 at the 95% confidence level

now we can examine the fit

tfit = linspace(0,1);
fit = myfunc(pars,tfit);
hold all
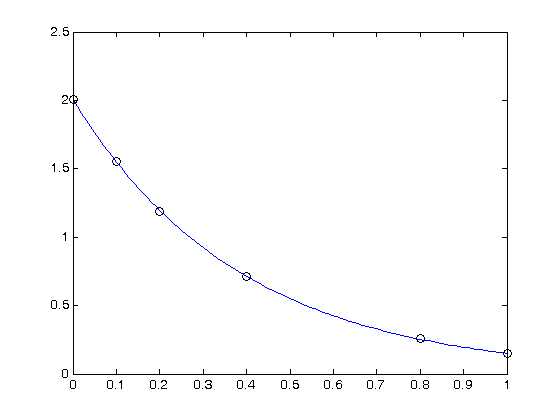
plot(tfit,fit)

You can see the fit looks ok. To summarize, here is a way to directly fit an ODE solution to data using the nonlinear fitting algorithms of Matlab. The advantage of this over a transformation, e.g. by computing the derivative or by plotting log(Ca/Cao) vs. something is that this approach avoids the nonlinear transformation of errors in the data. That comes at the expense of having to solve a nonlinear problem which requires an initial guess. Sometimes, that can be hard.

function to fit

This is the function we want to fit to the data. When we have the right pars, the output of this function should be a close fit to the data above. We use a nested function in a nested function to avoid needing lots of function handles to pass parameters around.

    function output = myfunc(pars,tspan)
        % we just rename the variable here for use in the ODE
        k = pars;
            function dCadt = ode(t,Ca)
                % this is the ODE we are fitting to
                dCadt = -k*Ca;
            end
        % we use the actual tspan data to get the solution to the ode at
        % the right points.
        Cao = Ca_data(1);
        [t,Ca] = ode45(@ode,tspan,Cao);
        output = Ca;
    end % myfunc
end % main

% categories: data analysis
Read and Post Comments

Delay differential equations

| categories: odes | View Comments

dde_example1

Contents

Delay differential equations

http://www.radford.edu/~thompson/webddes/tutorial.pdf (Problem 1 on page 32).

A model for predator-prey populations is given by:

$y_1'(t) = a y_1(t) + b y_1(t) y_2(t)$

$y_2'(t) = c y_2(t) + d y_1(t) y_2(t)$

where $y_1$ and $y_2$ are the prey and predators. These are ordinary differential equations that are straightforward to solve.

If there is a resource limitation on the prey and assuming the birth rate of predators responds to changes in the magnitude of the population y1 of prey and the population y2 of predators only after a time delay $\tau$, we can arrive at a new set of delay differential equations:

$y_1'(t) = a y_1(t)(1-y_1(t)/m) + b y_1(t) y_2(t)$

$y_2'(t) = c y_2(t) + d y_1(t-\tau) y_2(t-\tau)$

these equations cannot be solved with ordinary ODE solvers, because the value of the solution at any time $t$ depends on the value of the solution some time $\tau$ ago. So, even at $t=0$, we have to know the history to know the initial derivative is. We use the dde23 function in Matlab to solve this problem.
function main
clear all; close all; clc

The non-delay model

We first solve the ordinary model so we can see the impact of adding the delay.

a =0.25;
b= -0.01;
c= -1.00;
d=0.01;

y10 = 80; % initial population of prey
y20 = 30; % initial population of predator
tspan = [0 200]; % time span to integrate over
[t,Y] = ode45(@myode,tspan,[y10 y20]);

y1 = Y(:,1);
y2 = Y(:,2);

phase portrait of solution

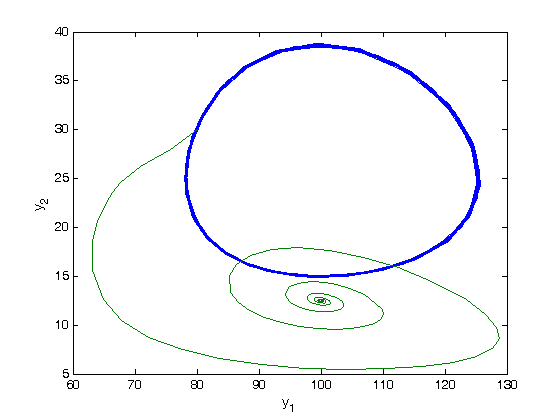
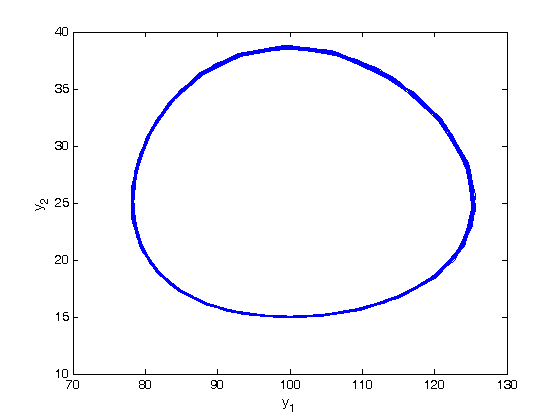
You can see a stable limit cycle (purely oscillatory behavior) in the population of prey and predators.

plot(y1,y2)
xlabel('y_1')
ylabel('y_2')
    function dYdt = myode(t,Y)
        % ordinary model
        y1 = Y(1);
        y2 = Y(2);

        dy1dt = a*y1 + b*y1*y2;
        dy2dt = c*y2 + d*y1*y2;

        dYdt = [dy1dt; dy2dt];
    end

The delay model

Now we solve the model with the delays. We solve this example with a delay of $\tau=1$.

lags = [1]; % this is where we specify the vector of taus

% we need a history function that is a column vector giving the value of y1
% and y2 in the past. Here we make these constant values.
     function y = history(t)
         y = [80; 30];
     end

% we define the function for the delay. the Y variable is the same as you
% should be used to from an ordinary differential equation. Z is the values
% of all the delayed variables.
    function  dYdt = ddefun(t,Y,Z)
        m = 200; % additional variable
        y1 = Y(1);
        y2 = Y(2);

        % Z(:,1) = [y1(t - tau_1); y2(t - tau_2)]
        y1_tau1 = Z(1,1);
        y2_tau1 = Z(2,1);

        dy1dt = a*y1*(1-y1/m) + b*y1*y2;
        dy2dt = c*y2 + d*y1_tau1*y2_tau1;

        dYdt = [dy1dt; dy2dt];
    end

now we solve with dde23

sol = dde23(@ddefun,lags,@history,tspan)

y1 = sol.y(1,:); % note the y-solution is a row-wise matrix.
y2 = sol.y(2,:);
sol = 

     solver: 'dde23'
    history: @dde_example1/history
    discont: [0 1 2 3]
          x: [1x127 double]
          y: [2x127 double]
      stats: [1x1 struct]
         yp: [2x127 double]

Add delay solution to the ordinary solution

hold all
plot(y1,y2)

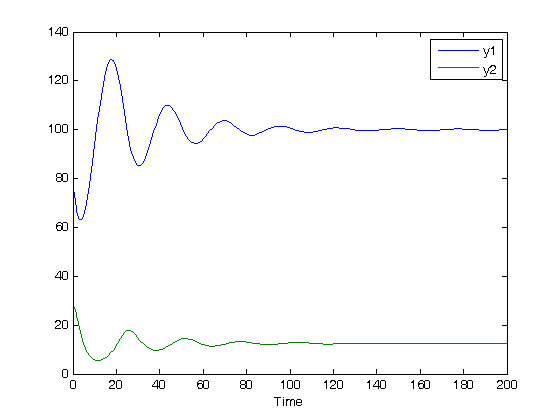
you can see the delay and resource limit significantly affect the solution. Here, it damps the oscillatory behavior, and seems to be leading to steady state population values.

figure
plot(sol.x,y1,sol.x,y2)
xlabel('Time')
legend 'y1' 'y2'
end

% categories: ODEs
% tags: delay differential equation
Read and Post Comments

Some basic data structures in Matlab

| categories: uncategorized | View Comments

Some basic data structures in Matlab

Some basic data structures in Matlab

John Kitchin

There are a variety of needs for storing complicated data in solving engineering problems.

Contents

cell arrays

A cell array can store a variety of data types. A cell array is enclosed by curly brackets. Here, we might store the following data in a variable to describe the Antoine coefficients for benzene and the range they are relevant for [Tmin Tmax]

c = {'benzene' 6.9056 1211.0 220.79 [-16 104]}
c = 

    'benzene'    [6.9056]    [1211]    [220.7900]    [1x2 double]

To access the elements of a cell array use curly brackets for indexing.

c{1}
ans =

benzene

you can also index the cell array, e.g. to get elements 2-4:

[A B C] = c{2:4}
A =

    6.9056


B =

        1211


C =

  220.7900

If you want to extract all the contents to variable names that are easy to read, use this syntax:

[name A B C Trange] = c{:}
name =

benzene


A =

    6.9056


B =

        1211


C =

  220.7900


Trange =

   -16   104

structures

a structure contains named fields that can contain a variety of data types. Structures are often used to set options

s = struct('name','benzene','A',6.9056,'B',1211.0')
s = 

    name: 'benzene'
       A: 6.9056
       B: 1211

And you can add fields like this:

s.C = 220.79
s.Trange = [-16 104]
s = 

    name: 'benzene'
       A: 6.9056
       B: 1211
       C: 220.7900


s = 

      name: 'benzene'
         A: 6.9056
         B: 1211
         C: 220.7900
    Trange: [-16 104]

we can access the data in a struct by the field

s.name
s.Trange
ans =

benzene


ans =

   -16   104

It is an error to access a non-existent field, so you can check if it exists like this.

if isfield(s,'field3')
    s.field3
else
    'no field 3 found'
end
ans =

no field 3 found

Not sure what fields are in the struct? This might be the case for a struct returned by a Matlab function, e.g. by an ode solver or optimization algorithm.

fieldnames(s)
ans = 

    'name'
    'A'
    'B'
    'C'
    'Trange'

containers.Map

A container.Map is like a dictionary, with a key:value relationship. You can use complicated key strings including spaces. By default, all keys must be the same type, e.g. all strings.

cM = containers.Map();
cM('name') = 'benzene';
cM('A') = 6.9056;
cM('B') = 1211.0;
cM('C') = 220.79;
cM('Trange') = [-16 104];
cM('key with spaces') = 'random thoughts';

and we can access the data in a map by key:

cM('name')
cM('key with spaces')
ans =

benzene


ans =

random thoughts

it is also an error access a non-existent key, so we can check if it exists like this.

if cM.isKey('tre')
    cM('tre')
else
    'no tre key found.'
end
ans =

no tre key found.

Summary

These are a few of the ways to store/organize data in matlab scripts/functions.

% categories: basic
Read and Post Comments

« Previous Page -- Next Page »