Fitting a numerical ODE solution to data
September 30, 2011 at 12:40 AM | categories: data analysis | View Comments
Contents
Fitting a numerical ODE solution to data
function main
clc; clear all; close all
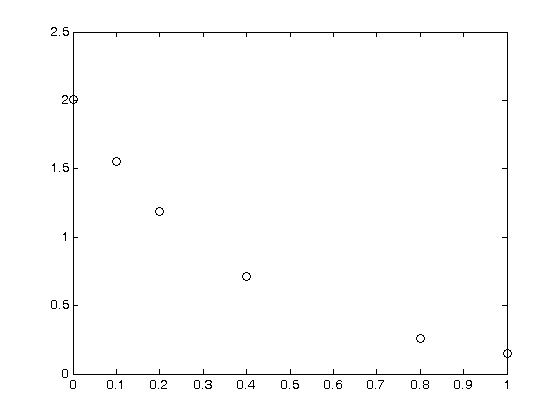
Suppose we know the concentration of A follows this differential equation:  , and we have the following data:
Lets make these column vectors
tspan = [0 0.1 0.2 0.4 0.8 1]';
Ca_data = [2.0081  1.5512  1.1903  0.7160  0.2562  0.1495]';
plot(tspan,Ca_data,'ko ')
In this case, one could solve the simple ODE, and transform the data to get a simple linear fit. Instead, we are going to develop a method to directly fit the ODE solution to the data.
parguess = [1.3]; % nonlinear fits need initial guesses
[pars, resid, J] = nlinfit(tspan,Ca_data,@myfunc,parguess)
pars =

    2.5889


resid =

         0
    0.0011
   -0.0062
    0.0031
    0.0031
   -0.0013


J =

         0
   -0.1550
   -0.2393
   -0.2852
   -0.2025
   -0.1508
the residuals are pretty low. J is a Jacobian, and we don't need to worry about it. It is used to estimate confidence intervals.
parameter confidence intervals
alpha = 0.05; % this is for 95% confidence intervals
pars_ci = nlparci(pars,resid,'jacobian',J,'alpha',alpha)

sprintf('The true value of k is between %1.2f and %1.2f at the 95%% confidence level',pars_ci)
pars_ci =

    2.5701    2.6077


ans =

The true value of k is between 2.57 and 2.61 at the 95% confidence level
now we can examine the fit
tfit = linspace(0,1);
fit = myfunc(pars,tfit);
hold all
plot(tfit,fit)
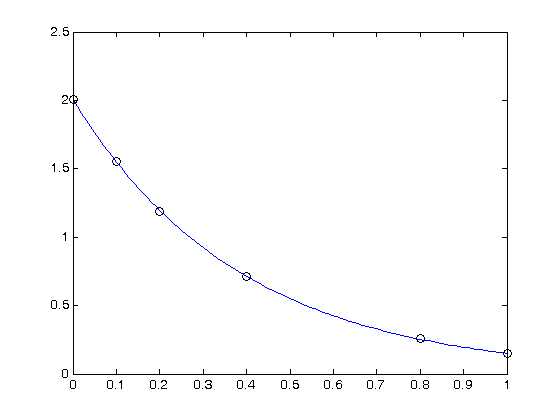
You can see the fit looks ok. To summarize, here is a way to directly fit an ODE solution to data using the nonlinear fitting algorithms of Matlab. The advantage of this over a transformation, e.g. by computing the derivative or by plotting log(Ca/Cao) vs. something is that this approach avoids the nonlinear transformation of errors in the data. That comes at the expense of having to solve a nonlinear problem which requires an initial guess. Sometimes, that can be hard.
function to fit
This is the function we want to fit to the data. When we have the right pars, the output of this function should be a close fit to the data above. We use a nested function in a nested function to avoid needing lots of function handles to pass parameters around.
    function output = myfunc(pars,tspan)
        % we just rename the variable here for use in the ODE
        k = pars;
            function dCadt = ode(t,Ca)
                % this is the ODE we are fitting to
                dCadt = -k*Ca;
            end
        % we use the actual tspan data to get the solution to the ode at
        % the right points.
        Cao = Ca_data(1);
        [t,Ca] = ode45(@ode,tspan,Cao);
        output = Ca;
    end % myfunc
end % main

% categories: data analysis