Better interpolate than never

| categories: basic matlab | View Comments

interp_methods

Contents

Better interpolate than never

John Kitchin

close all; clear all

We often have some data that we have obtained in the lab, and we want to solve some problem using the data. For example, suppose we have this data that describes the value of f at time t.

t = [0.5 1 3 6]
f = [0.6065    0.3679    0.0498    0.0025]
plot(t,f)
xlabel('t')
ylabel('f(t)')
t =

    0.5000    1.0000    3.0000    6.0000


f =

    0.6065    0.3679    0.0498    0.0025
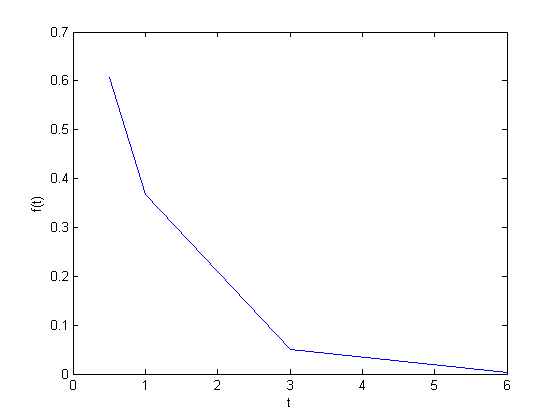
Estimate the value of f at t=2.

This is a simple interpolation problem.

interp1(t,f,2)
ans =

    0.2089

The function we sample above is actually f(t) = exp(-t). The linearly interpolated example isn't too accurate.

exp(-2)
ans =

    0.1353

improved interpolation

we can tell Matlab to use a better interpolation scheme: cubic polynomial splines like this. For this example, it only slightly improves the interpolated answer. That is because you are trying to estimate the value of an exponential function with a cubic polynomial, it fits better than a line, but it can't accurately reproduce the exponential function.

interp1(t,f,2,'cubic')
ans =

    0.1502

The inverse question

It is easy to interpolate a new value of f given a value of t. What if we want to know the time that f=0.2? We can approach this a few ways.

method 1

we setup an equation that interpolates f for us. Then, we setup another function that we can use fsolve on. The second function will be equal to zero at the time. The second function will look like 0 = 6.25 - f(t). The answer for 0.2=exp(-t) is t = 1.6094. Since we use interpolation here, we will get an approximate answer. The first method is not to bad.

func = @(time) interp1(t,f,time);
g = @(time) 0.2 - func(time);

initial_guess = 2;
ans = fsolve(g, initial_guess)
Equation solved.

fsolve completed because the vector of function values is near zero
as measured by the default value of the function tolerance, and
the problem appears regular as measured by the gradient.


ans =

    2.0556

method 2: switch the interpolation order

We can switch the order of the interpolation to solve this problem.

interp1(f,t,0.2)
interp1(f,t,0.2,'cubic')
ans =

    2.0556


ans =

    1.5980

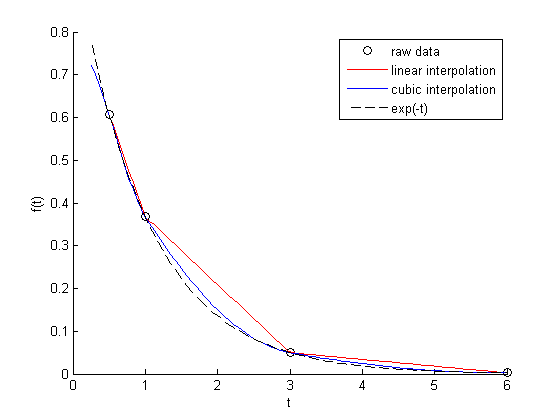
Note we get the same answer with linear interpolation, but a different answer with the cubic interpolation. Here the cubic interpolation does much better job of fitting. You can see why in this figure. The cubic interpolation is much closer to the true function over most of the range. Although, note that it overestimates in some regions and underestimates in other regions.

figure
hold all
x = linspace(0.25, 6);
plot(t,f,'ko ')
plot(x, interp1(t,f,x),'r-')
plot(x, interp1(t,f,x,'cubic'),'b-')
plot(x,exp(-x),'k--')
xlabel('t')
ylabel('f(t)')
legend('raw data','linear interpolation','cubic interpolation','exp(-t)')
A harder problem

Suppose we want to know at what time is 1/f = 100? Now we have to decide what do we interpolate: f(t) or 1/f(t). Let's look at both ways and decide what is best. The answer to $1/exp(-t) = 100$ is 4.6052

interpolate on f(t) then invert the interpolated number

g2 = @(time) 100 - 1./func(time);
initial_guess = 4.5;
a1 = fsolve(g2, initial_guess)
sprintf('%%error = %1.2f',((a1 - 4.6052)/2.5*100))
Equation solved.

fsolve completed because the vector of function values is near zero
as measured by the default value of the function tolerance, and
the problem appears regular as measured by the gradient.


a1 =

    5.5243


ans =

%error = 36.76

invert f(t) then interpolate on 1/f

ifunc2 = @(time) interp1(t,1./f,time);
g5 = @(time) 100 - ifunc2(time);
a2 = fsolve(g5, initial_guess)
sprintf('%%error = %1.2f',((a2 - 4.6052)/2.5*100))
Equation solved.

fsolve completed because the vector of function values is near zero
as measured by the default value of the function tolerance, and
the problem appears regular as measured by the gradient.


a2 =

    3.6311


ans =

%error = -38.96

discussion

In this case you get different errors, one overestimates and one underestimates the answer, and by a lot: ~plus or minus 37% . Let's look at what is happening.

plotting 1/f

figure
hold all
x = linspace(0.25, 6);
plot(t,1./f,'ko ')
plot(x, 1./interp1(t,f,x),'r-')
plot(x, interp1(t,1./f,x,'cubic'),'b-')
plot(x,1./exp(-x),'k--')
xlabel('t')
ylabel('1/f(t)')
legend('raw data','linear interpolation','cubic interpolation','1/exp(-t)')
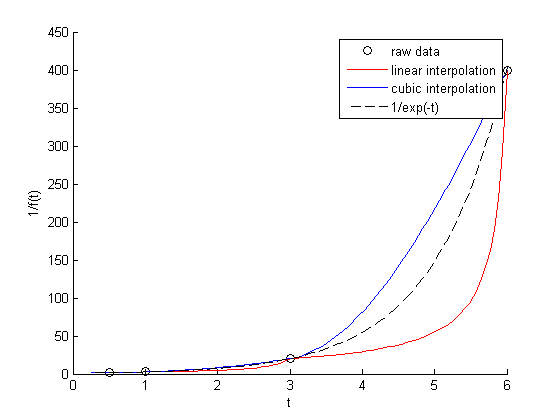
You can see that the cubic interpolation is overestimating the true function between 3 and 6, while the linear interpolation underestimates it. This is an example of where you clearly need more data in that range to make good estimates. Neither interpolation method is doing a great job. The trouble in reality is that you often do not know the real function to do this analysis. Here you can say the time is probably between 3.6 and 5.5 where 1/f(t) = 100, but you can't read much more than that into it. If you need a more precise answer, you need better data, or you need to use an approach other than interpolation. For example, you could fit an exponential function to the data and use that to estimate values at other times.

'done'

% categories: basic matlab
% tags: interpolation
ans =

done

Read and Post Comments

The trapezoidal method of integration

| categories: basic matlab | View Comments

trapezoidal_integration

Contents

The trapezoidal method of integration

John Kitchin

See http://en.wikipedia.org/wiki/Trapezoidal_rule

$$\int_a^b f(x) dx \approx \frac{1}{2}\displaystyle\sum\limits_{k=1}^N(x_{k+1}-x_k)(f(x_{k+1}) + f(x_k))$$

Let's compute the integral of sin(x) from x=0 to $\pi$. To approximate the integral, we need to divide the interval from $a$ to $b$ into $N$ intervals. The analytical answer is 2.0.

We will use this example to illustrate the difference in performance between loops and vectorized operations in Matlab.

a = 0; b = pi;
N = 1000; % this is the number of intervals

h = (b - a)/N; % this is the width of each interval
x = a:h:b; % note there are N+1 elements in this x vector
y = sin(x); % the sin function is already vectorized, so y contains N+1 elements

Trapezoid method using a loop

we use the tic and toc functions to time how long it takes to run.

tic
f = 0;
for k=1:N
    f = f + 0.5*((x(k+1)-x(k))*(y(k+1)+y(k)));
end
f
toc
f =

    2.0000

Elapsed time is 0.002520 seconds.

vectorized approach

tic
Xk = x(2:end)-x(1:end-1); % vectorized version of (x(k+1)-x(k))
Yk = y(2:end)+y(1:end-1); % vectorized version of (y(k+1)+y(k))

f = 0.5*sum(Xk.*Yk) % vectorized version of the loop above
toc

% It isn't strictly necessary to calculate Xk this way, since here by
% design every interval is the same width, but this approach would work for
% non-uniform x-values.
f =

    2.0000

Elapsed time is 0.000148 seconds.

total linear algebra way

In the last example, there may be loop buried in the sum command. Lets do one final method, using linear algebra, in a single line. The key to understanding this is to recognize the sum is just the result of a dot product of the x differences and y sums. We have to transpose the y sums to get the vector dimensions to work for the dot product (* is matrix multiplication/dot product in Matlab

tic
f = 0.5*(x(2:end)-x(1:end-1))*(y(2:end)+y(1:end-1))'
toc
f =

    2.0000

Elapsed time is 0.000130 seconds.

summary

The loop method is straightforward to code, and looks alot like the formula that defines the trapezoid method. the vectorized methods are not as easy to read, and take fewer lines of code to write. However, the vectorized methods are much faster than the loop, so the loss of readability could be worth it for very large problems.

% categories: basic matlab
% tags: math

% post_id = 1231; %delete this line to force new post;
% permaLink = http://matlab.cheme.cmu.edu/2011/10/14/the-trapezoidal-method-of-integration/;
Read and Post Comments

Sprintfing to the finish

| categories: basic matlab | View Comments

sprintfing

Contents

Sprintfing to the finish

John Kitchin

There are many times where you need to control the format of how variables are displayed in Matlab. A crude way to control this is through the format command. By default, Matlab shows decimal numbers on a fixed scale with 5 decimals.

1/3
0.25
10.1
ans =

    0.3333


ans =

    0.2500


ans =

   10.1000

To show more decimals, you can issue a 'format long' command

format long
1/3
0.25
10.1

% to reset the format to the default, simply call format
format
ans =

   0.333333333333333


ans =

   0.250000000000000


ans =

  10.100000000000000

But suppose you want to print results with the correct number of significant figures, which will vary. For that, you need the sprintf command. The sprintf command takes a string, with a format specifier in it, and replaces the format specifier with a numeric value. A typical specifier for a decimal number is %w.df, where w is the width of the field, and d is the number of decimals, or precision. The field width is the minimum number of characters to print. See the documentation for sprintf (doc sprintf) for much more detail. To print with only two decimal places, consider these two examples

n = 1/3;
a = sprintf('%1.2f', n)
a =

0.33

You can embed the format strings into a string

a = sprintf('The value of 1/3 to two decimal places is %1.2f', n)
% Note that sprintf returns a string, that can be used in other
% places.
a =

The value of 1/3 to two decimal places is 0.33

You can have more than one format string in a string, and then you have to have more than one value to pass to each format string. The values get passed in order.

sprintf('value 1 = %1.2f and value 2 = %1.4f', 1/3,1/6)
ans =

value 1 = 0.33 and value 2 = 0.1667

You can reuse a format string several times for multiple values

sprintf('The answers are: %1.2f  ', [1/3 1/6 1/9])
ans =

The answers are: 0.33  The answers are: 0.17  The answers are: 0.11  

Note that the whole string is repeated for each element in the array. To get a better output, we might put a carriage return after each line like this

sprintf('The answers are: %1.2f\n', [1/3 1/6 1/9])
ans =

The answers are: 0.33
The answers are: 0.17
The answers are: 0.11


Significant digit specification

If you know how many significant digits you want, we use the %g format string. To get 1/3 to 3 significant digits:

sprintf('%1.3g',1/3)
% Note the first zero is not significant
sprintf('%1.3g',4/3)
% Note we know this to lower precision, because the first digit is
% significant.
ans =

0.333


ans =

1.33

modifier flags to format strings

If you want to print a +- sign with the data, compare these two outputs:

sprintf('%1.2f\n',[-1 1])
% the decimals do not align, making it a little harder to read
ans =

-1.00
1.00


sprintf('%+1.2f\n',[-1 1])
% here the decimals align, and it is easier to read.
ans =

-1.00
+1.00


Scientific notation

the eps command gives you the smallest possible spacing between float numbers in matlab.

eps
ans =

  2.2204e-016

As a float, this number is practically zero to many decimal places. As a decimal, it is impractical to view.

sprintf('%1.12f',eps)
ans =

0.000000000000

Instead, we use scientific notation

a = sprintf('%1.2e',eps)
a =

2.22e-016

you can combine the string output with this syntax.

['the answer is: '  a]
ans =

the answer is: 2.22e-016

Or you can use fprintf

fprintf('the answer is: %1.2e\n',eps)
% What is the difference between fprintf and sprintf? fprintf prints
% directly to the screen, and does not output any result, avoiding the
the answer is: 2.22e-016
ans = ....
in the display window. So if you don't need the string output as a
variable, the results are cleaner with sprintf.

Summary

That is how simple it is to control the format of how your data is displayed. There are more options than shown here, but this is the majority of formatting I find necessary most of the time.

'done'

% categories: basic matlab
ans =

done

Read and Post Comments

On the quad, or trapz'd in ChemE heaven?

| categories: basic matlab | View Comments

on_the_quad

Contents

On the quad, or trapz'd in ChemE heaven?

John Kitchin

What is the difference between quad and trapz? The short answer is that quad integrates functions (via a function handle) using numerical quadrature, and trapz performs integration of arrays of data using the trapezoid method.

Let's look at some examples. We consider the example of computing $\int_0^2 x^3 dx$. the analytical integral is $1/4 x^4$, so we know the integral evaluates to 16/4 = 4. This will be our benchmark for comparison to the numerical methods.

clear all; clc; close all;

quad usage

This command is equivalent to $\int_0^2 x^3 dx$

i1 = quad(@(x) x.^3,0,2)
i1 =

     4

we can also define the function handle separately.

f = @(x) x.^3
f(2) % should be 8
f = 

    @(x)x.^3


ans =

     8

This command is equivalent to $\int_0^2 f(x) dx$

i1 = quad(f,0,2)
error = (i1 - 4)/4
% Note the error is very small!
i1 =

     4


error =

     0

Trapz usage

if we had numerical data like this, we use trapz to integrate it

x = [0 0.5 1 1.5 2];
y = f(x);  % or you could say y = x.^3

i2 = trapz(x,y)
error = (i2 - 4)/4
i2 =

    4.2500


error =

    0.0625

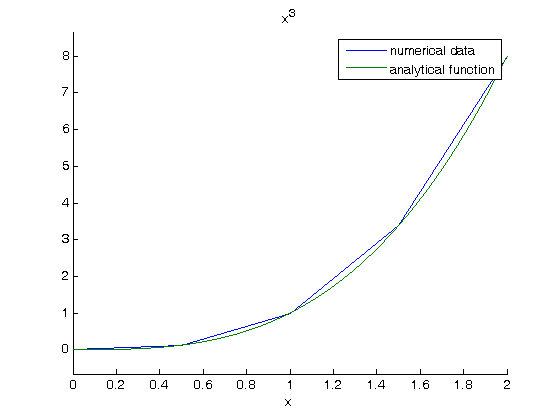
Note the integral of these vectors is greater than 4! You can see why here.

figure; hold all
plot(x,y)
ezplot(f,[0 2])
legend 'numerical data' 'analytical function'
% The area of the trapezoids is greater than the area under the function
% due to the coarse sampling of $f(x)=x^3$.

with a finer sampling we have:

x = linspace(0,2); % 100 points between 0, 1
y = x.^3;
i3 = trapz(x,y)
i3 =

    4.0004

and a much smaller error.

error = (i3 - 4)/4
error =

  1.0203e-004

Combining numerical data with quad

You might want to combine numerical data with the quad function if you want to perform integrals easily. Let's say you are given this data:

x = [0 0.5 1 1.5 2];
y = [0    0.1250    1.0000    3.3750    8.0000];

and you want to integrate this from x = 0.25 to 1.75. We don't have data in those regions, so some interpolation is going to be needed. Here is the analytical integral and by numerical quadrature

i_analytical = 1/4*(1.75^4-0.25^4)
i = quad(f,0.25,1.75)
% they are practically the same.
i_analytical =

    2.3438


i =

    2.3437

One way to do this with the data provided is to use interpolation on a fine-spaced x-grid, and then use trapz on the resulting interpolated vectors.

xfine = linspace(0.25,1.75);
yinterp = interp1(x,y,xfine);
i4 = trapz(xfine,yinterp)
error = (i4 - i_analytical)/i_analytical
i4 =

    2.5315


error =

    0.0801

Another approach is to create a function handle to do the interpolation for you. This combines numerical data with the quad function!

finterp = @(X) interp1(x,y,X);
i5 = quad(finterp,0.25,1.75)
error = (i5 - i_analytical)/i_analytical
i5 =

    2.5312


error =

    0.0800

these two approaches are actually identical, as they are both based on linear interpolation. The second approach is slightly more compact and easier to evaluate multiple integrals. Compare:

i6 = quad(finterp,0.28,1.64)
i6 =

    1.9596

to:

xfine = linspace(0.28,1.64);
yinterp = interp1(x,y,xfine);
i7 = trapz(xfine,yinterp)
% One line of code vs. three.
i7 =

    1.9597

Summary

trapz and quad are functions for getting integrals. Both can be used with numerical data if interpolation is used.

Finally, see this post for an example of solving an integral equation using quad and fsolve.

% categories: basic matlab
% tags: integration
Read and Post Comments

Indexing vectors and arrays in Matlab

| categories: basic matlab | View Comments

Indexing vectors and arrays in Matlab

Indexing vectors and arrays in Matlab

There are times where you have a lot of data in a vector or array and you want to extract a portion of the data for some analysis. For example, maybe you want to plot column 1 vs column 2, or you want the integral of data between x = 4 and x = 6, but your vector covers 0 < x < 10. Indexing is the way to do these things.

A key point to remember is that in Matlab array/vector indices start at 1.

Contents

we use the parentheses operator to index. It is possible to get a single element, a range of elements, or all the elements.

x = linspace(0,pi,10)
x =

  Columns 1 through 7

         0    0.3491    0.6981    1.0472    1.3963    1.7453    2.0944

  Columns 8 through 10

    2.4435    2.7925    3.1416

x(1)   % element 1
ans =

     0

x(3)   % element 3
ans =

    0.6981

x(1:3) % elements 1-3
ans =

         0    0.3491    0.6981

x(end) % the last element
ans =

    3.1416

the syntax a:n:b gets the elements starting at index a, skipping n elements up to the index b

x(1:3:end) % every third element
ans =

         0    1.0472    2.0944    3.1416

x(:) % getting all the elements. :note:`you get a column vector.`
ans =

         0
    0.3491
    0.6981
    1.0472
    1.3963
    1.7453
    2.0944
    2.4435
    2.7925
    3.1416

finding part of vector

suppose we want the part of the vector where x > 2. We could do that by inspection, but there is a better way. We can create a mask of boolean (0 or 1) values that specify whether x > 2 or not, and then use the mask

ind = x > 2
x(ind) % use indexing to get the part of x where x > 2
ind =

     0     0     0     0     0     0     1     1     1     1


ans =

    2.0944    2.4435    2.7925    3.1416

we can use the mask on other vectors too, to get the y-values where x > 2, for example, and then to integrate that subsection of data (or some other analysis).

y = sin(x)
y(ind)
trapz(y(ind),x(ind))
y =

  Columns 1 through 7

         0    0.3420    0.6428    0.8660    0.9848    0.9848    0.8660

  Columns 8 through 10

    0.6428    0.3420    0.0000


ans =

    0.8660    0.6428    0.3420    0.0000


ans =

   -2.3087

2D array indexing

in a 2D array, you index with (row,column)

a = [[1 2 3];[4 5 6]; [7 8 9]]
a =

     1     2     3
     4     5     6
     7     8     9

a(1,1) % upper left element
a(end,end) % lower right element
ans =

     1


ans =

     9

getting a row

to get a row, we specify the row number we want, and we need a syntax to specify every column index in that row. The syntax is to use a colon

a(1,:) % first row
ans =

     1     2     3

getting a column

a(:,1) % first column
ans =

     1
     4
     7

a(:) % all the elements of the a array as a column vector
ans =

     1
     4
     7
     2
     5
     8
     3
     6
     9

using indexing to assign values to rows and columns

b = zeros(size(a))
b =

     0     0     0
     0     0     0
     0     0     0

b(:,1) = [1 2 3] % define column 1
b =

     1     0     0
     2     0     0
     3     0     0

b(2,:) = [4 5 6] % define row 2
b =

     1     0     0
     4     5     6
     3     0     0

b(3,3) = 9 % define element (3,3)
b =

     1     0     0
     4     5     6
     3     0     9

b(9) = 12  % this redefines element (3,3)
b =

     1     0     0
     4     5     6
     3     0    12

3D arrays

the 3d array is like book of 2D matrices. Each page has a 2D matrix on it. think about the indexing like this: (row, column, page)

M = randn(3,3,3) % a 3x3x3 array
M(:,:,1) =

    1.7119   -0.8396    0.9610
   -0.1941    1.3546    0.1240
   -2.1384   -1.0722    1.4367


M(:,:,2) =

   -1.9609    2.9080   -1.0582
   -0.1977    0.8252   -0.4686
   -1.2078    1.3790   -0.2725


M(:,:,3) =

    1.0984   -2.0518   -1.5771
   -0.2779   -0.3538    0.5080
    0.7015   -0.8236    0.2820

M(:,:,1) % 2D array on page 1
ans =

    1.7119   -0.8396    0.9610
   -0.1941    1.3546    0.1240
   -2.1384   -1.0722    1.4367

M(:,1,1) % column 1 of array on page 1
ans =

    1.7119
   -0.1941
   -2.1384

M(2,:,2) % row 2 of array on page 2
ans =

   -0.1977    0.8252   -0.4686

Wrapup

The most common place to use indexing is probably when a function returns an array with the independent variable in column 1 and solution in column 2, and you want to plot the solution. Second is when you want to analyze one part of the solution. There are also applications in numerical methods, for example in assigning values to the elements of a matrix or vector.

% categories: basic matlab

% post_id = 916; %delete this line to force new post;
Read and Post Comments

Next Page ยป