Introduction to statistical data analysis

| categories: statistics | View Comments

basic_statistics

Contents

Introduction to statistical data analysis

John Kitchin

clear all
clc

Problem statement.

Given several measurements of a single quantity, determine the average value of the measurements, the standard deviation of the measurements and the 95% confidence interval for the average.

the data

y = [8.1 8.0 8.1];

the average and standard deviation

ybar = mean(y);
s = std(y);

the confidence interval

This is a recipe for computing the confidence interval. The strategy is:
1. compute the average
2. Compute the standard deviation of your data
3. Define the confidence interval, e.g. 95% = 0.95
4. compute the student-t multiplier. This is a function of the confidence
interval you specify, and the number of data points you have minus 1. You
subtract 1 because one degree of freedom is lost from calculating the
average. The confidence interval is defined as
ybar +- T_multiplier*std/sqrt(n).
ci = 0.95;
alpha = 1 - ci;

n = length(y); %number of elements in the data vector
T_multiplier = tinv(1-alpha/2, n-1);

ci95 = T_multiplier*s/sqrt(n);

% confidence interval
[ybar - ci95, ybar + ci95]

% we can say with 95% confidence that the true mean lies between these two
% values.
ans =

    7.9232    8.2101

% categories: statistics
Read and Post Comments

Numerical propogation of errors

| categories: statistics | View Comments

Numerical propogation of errors

Numerical propogation of errors

Propogation of errors is essential to understanding how the uncertainty in a parameter affects computations that use that parameter. The uncertainty propogates by a set of rules into your solution. These rules are not easy to remember, or apply to complicated situations, and are only approximate for equations that are nonlinear in the parameters.

We will use a Monte Carlo simulation to illustrate error propogation. The idea is to generate a distribution of possible parameter values, and to evaluate your equation for each parameter value. Then, we perform statistical analysis on the results to determine the standard error of the results.

We will assume all parameters are defined by a normal distribution with known mean and standard deviation.

Contents

adapted from here.

clear all;

N= 1e6; % # of samples of parameters

Error propogation for addition and subtraction

A_mu = 2.5; A_sigma = 0.4;
B_mu = 4.1; B_sigma = 0.3;

A = A_mu + A_sigma*randn(N,1);
B = B_mu + B_sigma*randn(N,1);

p = A + B;
m = A - B;
std(p)
std(m)
ans =

    0.4999


ans =

    0.4997

here is the analytical std dev of these two quantities. It agrees with the numerical answers above

sqrt(A_sigma^2 + B_sigma^2)
ans =

    0.5000

multiplication and division

F_mu = 25; F_sigma = 1;
x_mu = 6.4; x_sigma = 0.4;

F = F_mu + F_sigma*randn(N,1);
x = x_mu + x_sigma*randn(N,1);

Multiplication

t = F.*x;
std(t)
ans =

   11.8721

analytical stddev for multiplication

std_t = sqrt((F_sigma/F_mu)^2 + (x_sigma/x_mu)^2)*F_mu*x_mu
std_t =

   11.8727

division

this is really like multiplication: F/x = F * 1/x

d = F./x;
std(d)
ans =

    0.2938

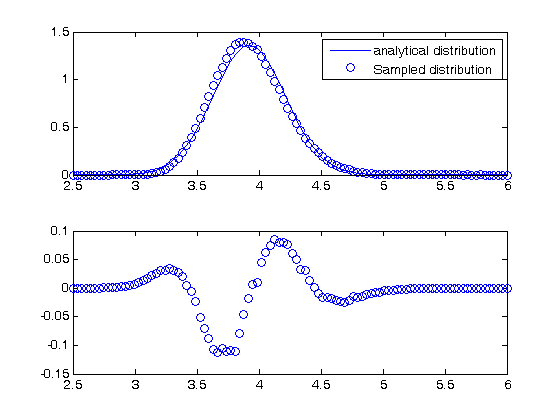
not that in the division example above, the result is nonlinear in x. You can actually see that the division product does not have a normal distribution if we look. It is subtle in this case, but when we look at the residual error between the analytical distribution and sampled distribution, you can see the errors are not random, indicating the normal distribution is not the correct model for the distribution of F/x. F/x is approximately normally distributed, so the normal distribution statistics are good estimates in this case. but that may not always be the case.

bins = linspace(2.5,6);
counts = hist(d,bins);

mu = mean(d);
sigma = std(d);

see Post 1005 .

bin_width = (max(bins)-min(bins))/length(bins);
subplot(2,1,1)
plot(bins,1/sqrt(2*pi*sigma^2)*exp(-((bins-mu).^2)./(2*sigma^2)),...
    bins,counts/N/bin_width,'bo')
legend('analytical distribution','Sampled distribution')
subplot(2,1,2)
% residual error between sampled and analytical distribution
diffs = (1/sqrt(2*pi*sigma^2)*exp(-((bins-mu).^2)./(2*sigma^2)))...
    -counts/N/bin_width;
plot(bins,diffs,'bo')
% You can see the normal distribution systematically over and under
% estimates the sampled distribution in places.

analytical stddev for division

std_d = sqrt((F_sigma/F_mu)^2 + (x_sigma/x_mu)^2)*F_mu/x_mu
std_d =

    0.2899

exponents

this rule is different than multiplication (A^2 = A*A) because in the previous examples we assumed the errors in A and B for A*B were uncorrelated. in A*A, the errors are not uncorrelated, so there is a different rule for error propogation.

t_mu = 2.03; t_sigma = 0.01*t_mu; % 1% error
A_mu = 16.07; A_sigma = 0.06;

t = t_mu + t_sigma*randn(N,1);
A = A_mu + A_sigma*randn(N,1);

Compute t^5 and sqrt(A) with error propogation

Numerical relative error

std(t.^5)
ans =

    1.7252

Analytical error

(5*t_sigma/t_mu)*t_mu^5
ans =

    1.7237

Compute sqrt(A) with error propogation

std(sqrt(A))
ans =

    0.0075

1/2*A_sigma/A_mu*sqrt(A_mu)
ans =

    0.0075

the chain rule in error propogation

let v = v0 + a*t, with uncertainties in vo,a and t

vo_mu = 1.2; vo_sigma = 0.02;
a_mu = 3; a_sigma = 0.3;
t_mu = 12; t_sigma = 0.12;

vo = vo_mu + vo_sigma*randn(N,1);
a = a_mu + a_sigma*randn(N,1);
t = t_mu + t_sigma*randn(N,1);

v = vo + a.*t;
std(v)
ans =

    3.6167

here is the analytical std dev.

sqrt(vo_sigma^2 + t_mu^2*a_sigma^2 + a_mu^2*t_sigma^2)
ans =

    3.6180

Summary

You can numerically perform error propogation analysis if you know the underlying distribution of errors on the parameters in your equations. One benefit of the numerical propogation is you don't have to remember the error propogation rules. Some limitations of this approach include

  1. You have to know the distribution of the errors in the parameters
  2. You have to assume the errors in parameters are uncorrelated.
% categories: statistics
Read and Post Comments

Random thoughts

| categories: statistics | View Comments

random_thoughts

Contents

Random thoughts

John Kitchin

clear all; close all; clc

Random numbers in Matlab

Random numbers are used in a variety of simulation methods, most notably Monte Carlo simulations. In another later post, we will see how we can use random numbers for error propogation analysis. First, we discuss two types of pseudorandom numbers we can use in Matlab: uniformly distributed and normally distributed numbers.

Uniformly distributed pseudorandom numbers

the :command:`rand` generates pseudorandom numbers uniformly distributed between 0 and 1, but not including either 0 or 1.

Single random numbers

Say you are the gambling type, and bet your friend $5 the next random number will be greater than 0.49

n = rand
if n > 0.49
    'You win!'
else
    'You lose ;('
end
n =

    0.6563


ans =

You win!

Arrays of random numbers

The odds of you winning the last bet are slightly stacked in your favor. There is only a 49% chance your friend wins, but a 51% chance that you win. Lets play the game 100,000 times and see how many times you win, and your friend wins. First, lets generate 100,000 numbers and look at the distribution with a histogram.

N = 100000;
games = rand(N,1);
nbins = 20;
hist(games,nbins)
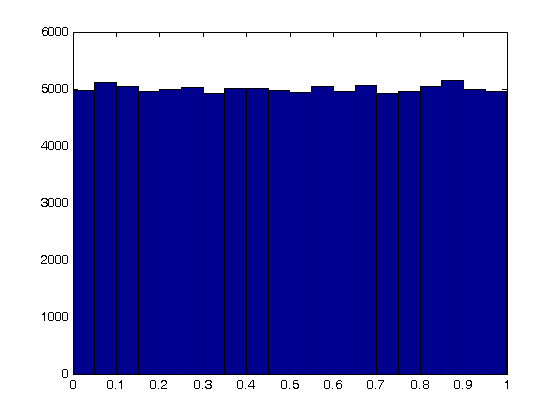
% Note that each bin has about 5000 elements. Some have a few more, some a
% few less.

Now, lets count the number of times you won.

wins = sum(games > 0.49)
losses = sum(games <= 0.49)

sprintf('percent of games won is %1.2f',(wins/N*100))
% the result is close to 51%. If you run this with 1,000,000 games, it gets
% even closer.
wins =

       51038


losses =

       48962


ans =

percent of games won is 51.04

random integers uniformly distributed over a range

the rand command gives float numbers between 0 and 1. If you want a random integer, use the randi command.

randi([1 100]) % get a random integer between 1 and 100
randi([1 100],3,1) % column vector of three integers
randi([1 100],1,3) % row vector of three integers
ans =

    65


ans =

    30
    89
    85


ans =

    62     5    97

Normally distributed numbers

The normal distribution is defined by $f(x)=\frac{1}{\sqrt{2\pi \sigma^2}} \exp (-\frac{(x-\mu)^2}{2\sigma^2})$ where $\mu$ is the mean value, and $\sigma$ is the standard deviation. In the standard distribution, $\mu=0$ and $\sigma=1$.

mu = 0; sigma=1;

get a single number

R = mu + sigma*randn
R =

   -0.4563

get a lot of normally distributed numbers

N = 100000;
samples = mu + sigma*randn(N,1);

We define our own bins to do the histogram on

bins = linspace(-5,5);
% and get the counts in each bin also
counts = hist(samples, bins);

Comparing the random distribution to the normal distribution

to compare our sampled distribution to the analytical normal distribution, we have to normalize the histogram. The probability density of any bin is defined by the number of counts for that bin divided by the total number of samples divided by the width

the bin width is the range of bins divided by the number of bins.

bin_width = (max(bins)-min(bins))/length(bins);
plot(bins,1/sqrt(2*pi*sigma^2)*exp(-((bins-mu).^2)./(2*sigma^2)),...
    bins,counts/N/bin_width,'bo')
legend('analytical distribution','Sampled distribution')
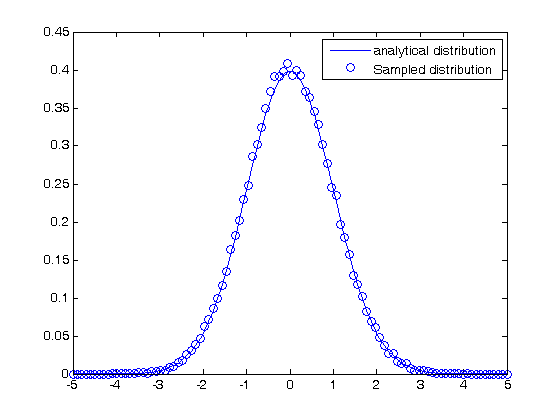
% For the most part, you can see the two distributions agree. There is some
% variation due to the sampled distribution having a finite number of
% samples. As you increase the sample size, the agreement gets better and
% better.

some properties of the normal distribution

What fraction of points lie between plus and minus one standard deviation of the mean?

samples >= mu-sigma will return a vector of ones where the inequality is true, and zeros where it is not. (samples >= mu-sigma) & (samples <= mu+sigma) will return a vector of ones where there is a one in both vectors, and a zero where there is not. In other words, a vector where both inequalities are true. Finally, we can sum the vector to get the number of elements where the two inequalities are true, and finally normalize by the total number of samples to get the fraction of samples that are greater than -sigma and less than sigma.

a1 = sum((samples >= mu-sigma) & (samples <= mu+sigma))/N*100;
sprintf('%1.2f %% of the samples are within plus or minus one standard deviation of the mean.',a1)
ans =

68.44 % of the samples are within plus or minus one standard deviation of the mean.

What fraction of points lie between plus and minus two standard deviations of the mean?

a2 = sum((samples >= mu - 2*sigma) & (samples <= mu + 2*sigma))/N*100;
sprintf('%1.2f %% of the samples are within plus or minus two standard deviations of the mean.',a2)
% this is where the rule of thumb that a 95% confidence interval is plus or
% minus two standard deviations from the mean.
ans =

95.48 % of the samples are within plus or minus two standard deviations of the mean.

Summary

Matlab has a variety of tools for generating pseudorandom numbers of different types. Keep in mind the numbers are only pseudorandom, but they are still useful for many things as we will see in future posts.
% categories: statistics
% tags: math
Read and Post Comments