Interacting with your graph through mouse clicks
November 22, 2011 at 08:02 PM | categories: plotting | View Comments
Contents
Interacting with your graph through mouse clicks
John Kitchin
This post continues a series of posts on interacting with Matlab graphs. In Post 1484 we saw an example of customizing a datatip. The limitation of that approach was that you can only click on data points in your graph. Today we examine a way to get similar functionality by defining a function that is run everytime you click on a graph.
You will get a better idea of what this does by watching this short video: http://screencast.com/t/tTm0NlI0eI
function main
close all
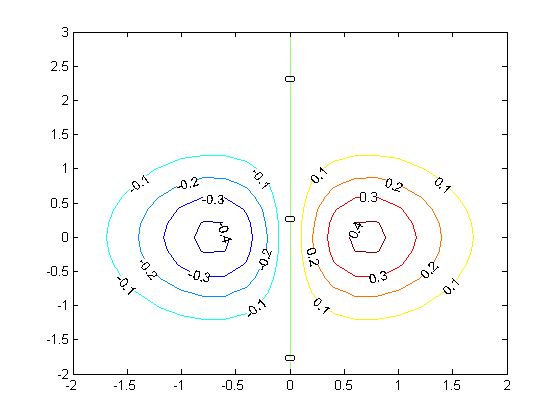
Simple contour graph
[X,Y] = meshgrid(-2:.2:2,-2:.2:3);
Z = X.*exp(-X.^2-Y.^2);
[C,h] = contour(X,Y,Z); clabel(C,h);
we can define a function that does something when we click on the graph. We will have the function set the title of the graph to the coordinates of the point we clicked on, and we will print something different depending on which button was pressed. We also want to leave some evidence of where we clicked so it is easy to see. We will put a red plus sign at the point we clicked on.
add an invisible red plus sign to the plot
hold on
cursor_handle = plot(0,0,'r+ ','visible','off')
cursor_handle =

  212.0385

define the callback function
this function will be called for every mouseclick in the axes.
  function mouseclick_callback(gcbo,eventdata)
      % the arguments are not important here, they are simply required for
      % a callback function. we don't even use them in the function,
      % but Matlab will provide them to our function, we we have to
      % include them.
      %
      % first we get the point that was clicked on
      cP = get(gca,'Currentpoint');
      x = cP(1,1);
      y = cP(1,2);
      % Now we find out which mouse button was clicked, and whether a
      % keyboard modifier was used, e.g. shift or ctrl
      switch get(gcf,'SelectionType')
          case 'normal' % Click left mouse button.
              s = sprintf('left: (%1.4g, %1.4g) level = %1.4g',x,y, x.*exp(-x.^2-y.^2));
          case 'alt'    % Control - click left mouse button or click right mouse button.
              s = sprintf('right: (%1.4g, %1.4g level = %1.4g)',x,y, x.*exp(-x.^2-y.^2));
          case 'extend' % Shift - click left mouse button or click both left and right mouse buttons.
              s = sprintf('2-click: (%1.4g, %1.4g level = %1.4g)',x,y, x.*exp(-x.^2-y.^2));
          case 'open'   % Double-click any mouse button.
              s = sprintf('double click: (%1.4g, %1.4g) level = %1.4g',x,y, x.*exp(-x.^2-y.^2));
      end
      % get and set title handle
      thandle = get(gca,'Title');
      set(thandle,'String',s);
      % finally change the position of our red plus, and make it
      % visible.
      set(cursor_handle,'Xdata',x,'Ydata',y,'visible','on')
  end

% now attach the function to the axes
set(gca,'ButtonDownFcn', @mouseclick_callback)

% and we also have to attach the function to the children, in this
% case that is the line in the axes.
set(get(gca,'Children'),'ButtonDownFcn', @mouseclick_callback)

Now, click away and watch the title change!
end

% categories: plotting
% tags: interactive