Interacting with labeled data points
November 11, 2011 at 03:46 PM | categories: plotting | View Comments
Contents
Interacting with labeled data points
John Kitchin
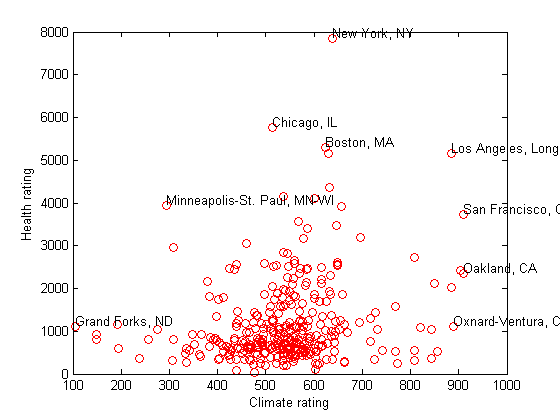
Matlab has a lot of capabilities for interacting graphically with data sets. Let's consider a dataset that contains ratings for different cities in different categories, such as health and climate. We suppose there could be a correlation between these two ratings and we want to check that.
Watch the video: http://screencast.com/t/PeIzxp3n
clear ; close all; clc
load cities % Matlab example data set
extract data for easy plotting
climate = ratings(:,1);
health  = ratings(:,3);
plot(climate,health,'ro')
xlabel('Climate rating')
ylabel('Health rating')

Identifying each data point.
gname(names)


% categories: plotting

% post_id = 1431; %delete this line to force new post;
% permaLink = http://matlab.cheme.cmu.edu/2011/11/11/interacting-with-labeled-data-points/;
