Customizing plots after the fact
September 16, 2011 at 11:22 PM | categories: plotting | View Comments
Customizing plots after the fact
John Kitchin
Sometimes it is desirable to make a plot that shows the data you want to present, and to customize the details, e.g. font size/type and line thicknesses afterwards. It can be tedious to try to add the customization code to the existing code that makes the plot. Today, we look at a way to do the customization after the plot is created.
clear all; close all; clc
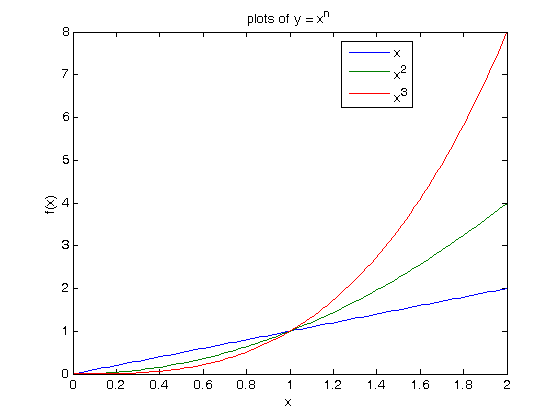
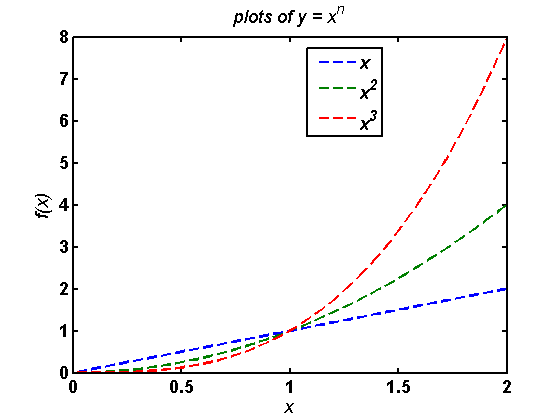
x = linspace(0,2);
y1 = x;
y2 = x.^2;
y3 = x.^3;

plot(x,y1,x,y2,x,y3)
xlabel('x')
ylabel('f(x)')
title('plots of y = x^n')
legend({'x' 'x^2' 'x^3'},'location','best')
Matlab uses handle graphics with the set command to change properties. We can use a set of find commands to locate the Matlab object containing the current figure, and then a findall command to get the handles to all the axes, lines, and text in the current figure. Then we use the set command to change the properties of those objects!
a=findobj(gcf);
Each of the numbers that come from these commands represent an object that we have to set the properties of. You can see there are a lot of them. That is why it is difficult to change all them when you make the plot.
allaxes=findall(a,'Type','axes')
alllines=findall(a,'Type','line')
alltext=findall(a,'Type','text')
allaxes =

  181.0081
  173.0081
  181.0081
  173.0081


alllines =

  191.0081
  190.0081
  188.0081
  187.0081
  185.0081
  184.0081
  176.0081
  175.0081
  174.0085
  191.0081
  190.0081
  188.0081
  187.0081
  185.0081
  184.0081
  176.0081
  175.0081
  174.0085
  191.0081
  190.0081
  188.0081
  187.0081
  185.0081
  184.0081
  176.0081
  175.0081
  174.0085


alltext =

  235.0081
  234.0081
  233.0081
  232.0081
  189.0081
  186.0081
  183.0081
  182.0081
  231.0081
  230.0081
  192.0081
  180.0081
  179.0081
  178.0081
  177.0081
  235.0081
  234.0081
  233.0081
  232.0081
  189.0081
  186.0081
  183.0081
  182.0081
  231.0081
  230.0081
  192.0081
  180.0081
  179.0081
  178.0081
  177.0081
  189.0081
  186.0081
  183.0081
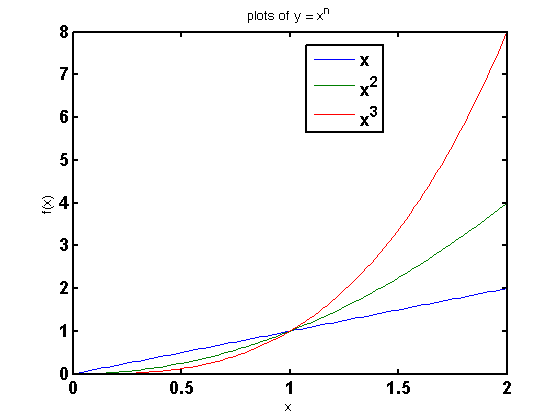
Now we set the font to Arial, bold, 14 pt on the axes, and make the axes thicker.
set(allaxes,'FontName','Arial','FontWeight','Bold','LineWidth',2,'FontSize',14);
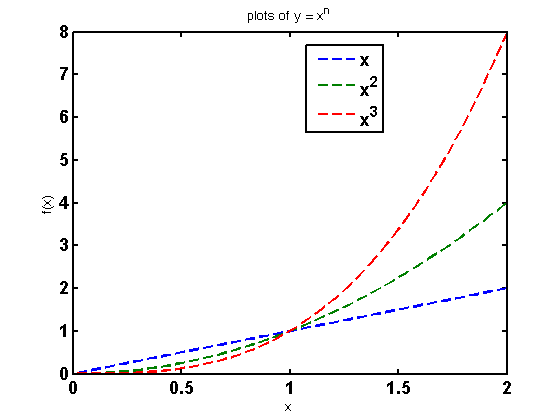
we set the plot lines to be thicker and dashed
set(alllines,'Linewidth',2,'Linestyle','--');
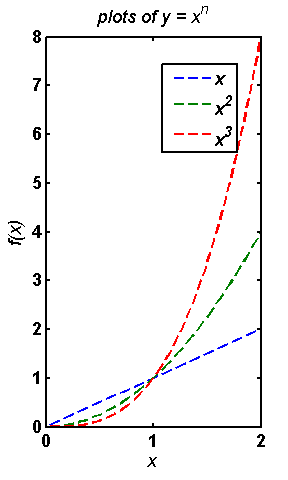
and set all other text (labels, and titles) to be 14pt italic Arial
set(alltext,'FontName','Arial','FontAngle','italic','FontSize',14);
we can even change the figure width and height
width = 3; height = 5;
set(gcf,'units','inches','position',[1 1 width height])

% categories: plotting