Plot customizations - Modifying line, text and figure properties
August 01, 2011 at 03:13 PM | categories: plotting | View Comments
Contents
Plot customizations - Modifying line, text and figure properties
John Kitchin
The plot command allows you to specify many properties of the lines in your plots, e.g. the line color, width, and style, and the marker properties. For presentations, it is usually a good idea to use thicker lines so they are easy to see from a projector. Here we examine some ways to do that.
close all; clear all; clc

x1 = 0:0.1:2*pi;
y1 = sin(x1);
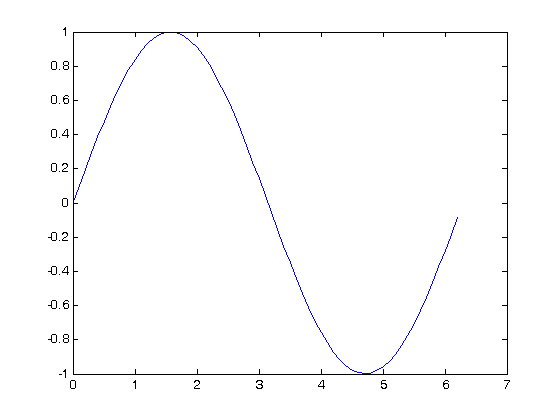
The vanilla plot
plot(x1,y1)

Customized plot
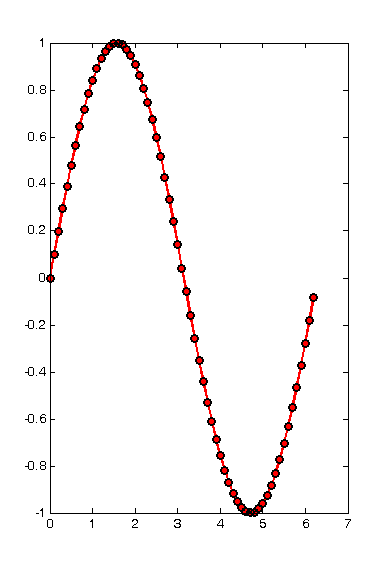
Lets increase the line thickness, change the line color to red, and make the markers red circles with black outlines. I also like figures in presentations to be 6 inches high, and 4 inches wide.
width = 4;
height = 6;
figure('Units','inches','Position',[1 1 width height])
plot(x1,y1,...
    'linewidth',2,...
    'color','r',...
    'marker','o',...
    'markeredgecolor','k',...
    'markerfacecolor','r')

customizing the axis labels
sometimes it is nice to change the size and style of the label text.
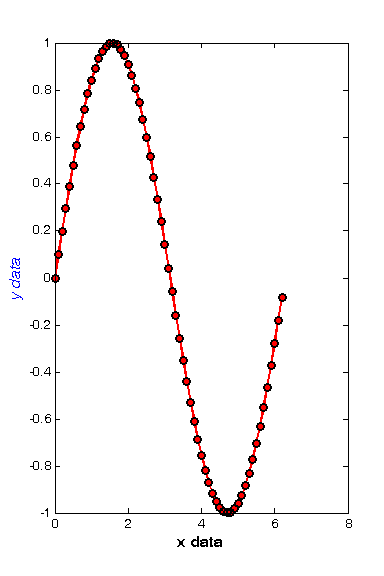
xlabel('x data','fontsize',12,'fontweight','bold')
ylabel('y data','fontsize',12,'fontangle','italic','color','b')

See this page for a listing of all the text properties you can set. http://www.mathworks.com/help/techdoc/ref/text_props.html
setting all the text properties in a figure.
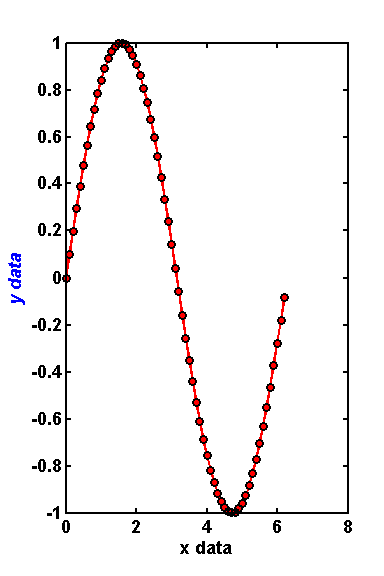
you may notice the axis tick labels are not consistent with the labels now. If you have many plots it can be tedious to try setting each text property. Matlab to the rescue! With these commands you can find all the text instances, and change them all at one time! Likewise, you can change all the lines, and all the axes.
a=findobj(gcf); % get the handles associated with the current figure

allaxes=findall(a,'Type','axes');
alllines=findall(a,'Type','line');
alltext=findall(a,'Type','text');

set(allaxes,'FontName','Arial','FontWeight','Bold','LineWidth',2,...
    'FontSize',14);
set(alllines,'Linewidth',2);
set(alltext,'FontName','Arial','FontWeight','Bold','FontSize',14);

% categories: Plotting

% post_id = 588; %delete this line to force new post;
