Interpolation of data
August 01, 2011 at 06:18 PM | categories: basic matlab | View Comments
Contents
Interpolation of data
when we have data at two points but we need data in between them we use interpolation. Suppose we have the points (4,3) and (6,2) and we want to know the value of y at x=4.65, assuming y varies linearly between these points. we use the interp1 command to achieve this.
x = [4 6]
y = [3 2]

interp1(x,y,4.65)
x =

     4     6


y =

     3     2


ans =

    2.6750
multiple interpolation values
you can interpolate several values
interp1(x,y,[4.65 5.01 4.2 9])
% note that you cannot interpolate outside the region where data is
% defined. That is why the value at x=9 is NaN.
ans =

    2.6750    2.4950    2.9000       NaN
more sophisticated interpolation.
the default interpolation method is simple linear interpolation between points. Other methods exist too, such as fitting a spline to the data and using the spline representation to interpolate from.
x = [1 2 3 4];
y = [1 4 9 16]; % y = x^2
xi = [ 1.5 2.5 3.5]; % we want to interpolate on these values
y1 = interp1(x,y,xi);
y2 = interp1(x,y,xi,'spline')
y2 =

    2.2500    6.2500   12.2500
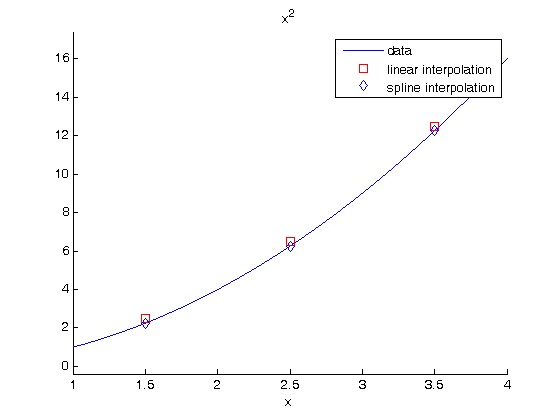
Compare these methods by plotting each set of interpolated values
the data we interpolated was constructed from y = x^2
figure
hold on
ezplot('x^2',[1 4])
plot(xi,y1,'rs',xi,y2,'bd')
legend('data','linear interpolation','spline interpolation')
hold off

summary: in this case the spline interpolation is a little more accurate than the linear interpolation. That is because the underlying data was polynomial in nature, and a spline is like a polynomial. That may not always be the case, and you need some engineering judgement to know which method is best.
% categories: Basic Matlab
% tags: math