Picasso's short lived blue period with Matlab
September 14, 2011 at 01:03 PM | categories: plotting | View Comments
Contents
Picasso's short lived blue period with Matlab
John Kitchin
It is an unknown fact that Picasso had a brief blue plotting period with Matlab before moving on to his more famous paintings. It started from irritation with the default colors available in Matlab for plotting. After watching his friend van Gogh cut off his own ear out of frustration with the ugly default colors, Picasso had to do something different.
clear all; clc; close all
default colors
Picasso wanted a series of horizontal lines with an eye-pleasing sequence of colors.
figure
hold all

% this plots horizontal lines for each y value of m.
for m = 1:0.5:50
  plot([0 50], [m m]);
end
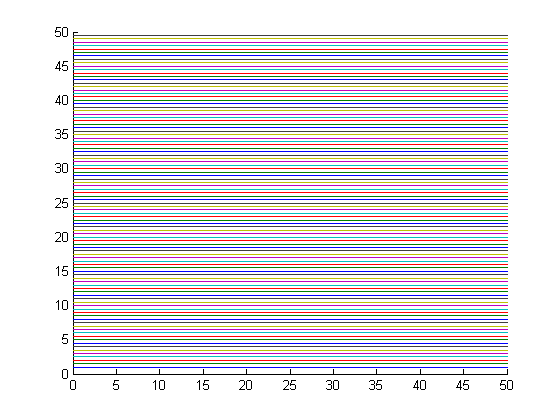
egads! that is rough on the eyes. Picasso figured out a way to customize the plot color order for a figure! He used the cmu.colors function to create an array of colors, blues in this case in the order he wanted them plotted, roughly light to dark. see http://en.wikipedia.org/wiki/List_of_colors for a list of colors available, and install version 1.7 of +cmu.
customizing the order colors are plotted in
It is convenient to define this function handle shortcut to avoid having to type cmu.colors('alice blue') for every color
c = @cmu.colors;
Now we make an array of the colors we want.
blues = [c('alice blue')
    c('light blue')
    c('baby blue')
    c('sky blue')
    c('maya blue')
    c('cornflower blue')
    c('bleu de france')
    c('azure')
    c('sapphire')
    c('cobalt')
    c('blue')
    c('navy blue')
    c('duke blue')]
blues =

    0.9400    0.9700    1.0000
    0.6800    0.8500    0.9000
    0.4700    0.8100    0.9400
    0.5300    0.8100    0.9200
    0.4500    0.7600    0.9800
    0.3900    0.5800    0.9300
    0.1900    0.5500    0.9100
         0    0.5000    1.0000
    0.0600    0.3200    0.7300
         0    0.2800    0.6700
         0         0    1.0000
         0         0    0.5000
         0         0    0.6100
Create a figure, and set the color order property. gca is a command for get current axes, and we set the ColorOrder on that axes.
figure
set(gca, 'ColorOrder', blues)
use the hold all command to preserve the ColorOrder on each subsequent plot
hold all

for m = 1:0.5:50
  plot([0 50], [m m]);
end
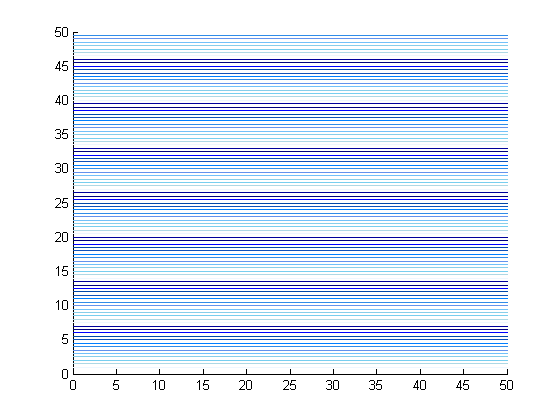
This is much nicer to look at!
Summary
You can specify the ColorOrder for plots as described above. Picasso eventually gave up on Matlab as an artform, and moved on to painting.
% categories: plotting